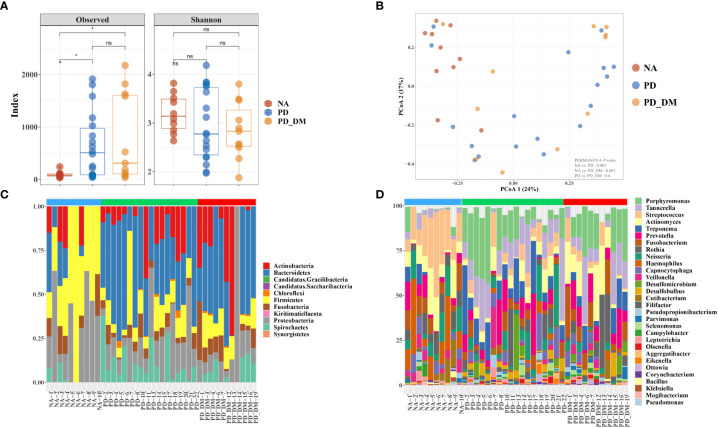
Figure 1.
Compositional distinction of oral microbiota between NA, PD, and PD_DM. (A) The comparison of oral microbiota alpha diversity between each group, including species richness (represented by Chao1) and evenness (represented by Shannon and pielou). (B) The principal component analysis (PCA) plot is shown generated by applying phyloseq to the species level count data. Each point represents one sample, and the samples are colored by status. The percentage of variation explained by each principal component is depicted on each axis. Stacked bar-plot representation of microbiota compositions during NA, PD, and PD_DM, with taxonomic features collapsed at the level of (C) phyla and (D) genera. The genera represent the top 30 strains. Blue bar, NA; green bar, PD; red bar, PD_DM. *p < 0.05; ns, no significance.

