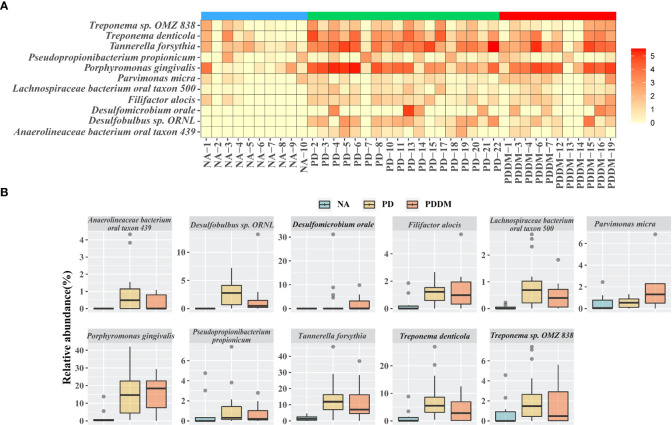
Figure 2.
Key microbiome changes between NA and PD or PD_DM by differential abundance analysis. (A) Heatmap of the relative abundances (log2 transformed) and most abundantly present species in the PD or PD_DM. (B) Abundances of 11 significantly different bacterial species. Boxplots represent relative abundance of individual species in each group. A p-value < 0.05 is considered significant and the cutoff average relative abundance is > 0.5%.

