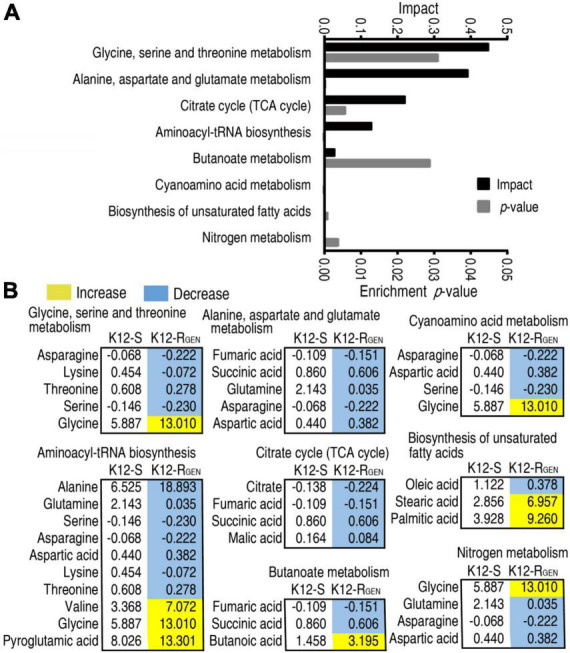
FIGURE 4.

Pathway enrichment analysis. (A) Pathway enrichment of differential metabolites in K12-RGEN. (B) Integrative analysis of metabolites in significantly enriched pathways. Yellow and light blue indicate increased and decreased metabolites, respectively.
