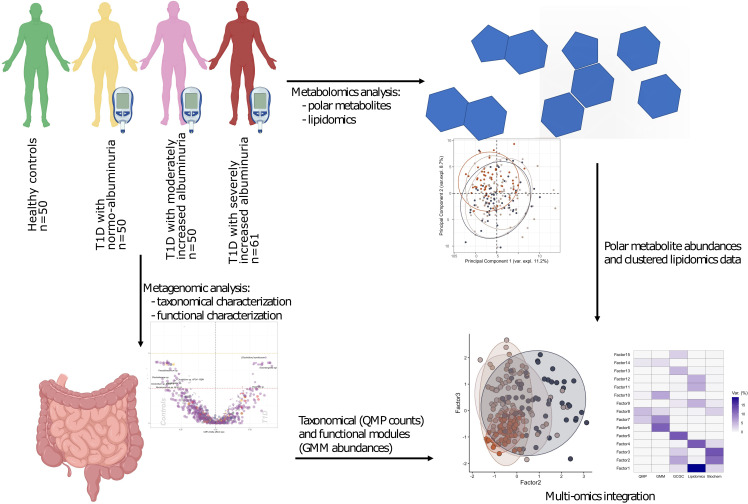
Figure 1.
Study design and analytical overview. The study cohort comprised 50 healthy and 161 individuals with T1D, who stratified on albuminuria levels: normo-albuminuria (n=50, albuminuria levels =<3.39 mg/mmol), moderately increased albuminuria (n=50, albuminuria levels =3.39–33.79 mg/mmol) and severely increased albuminuria (n=61, albuminuria levels =≥33.90 mg/mmol). For each study participant 1) plasma samples were collected to perform non-targeted metabolomics analysis, including both polar metabolites and lipids, and 2) faecal samples collected for metagenomics analysis. For the metagenomic samples, differences between the clinical groups at both taxonomical and functional level were assessed. Lipidomics data was clustered into highly correlated lipid clusters in order to reduce dimensionality. Finally, different omics data types were integrated with the Multi Omics Factor Analysis (MOFA+) tool and metabolite origin screened to identify bacterial- and host-related metabolites through Least Shrinkage Selector Operator (LASSO) regression models. QMP, Quantitative Microbial Profiles; GMM, Gut Metabolic Modules.

