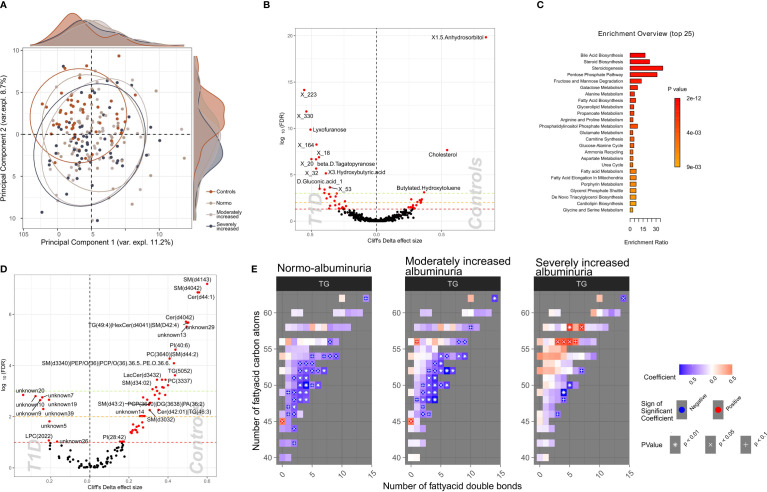
Figure 4.
Profiles of plasma polar metabolites and lipids in T1D and healthy control individuals. (A) Scores plot resulting from the partial least square discriminant analysis (PLS-DA) demonstrating polar metabolites that contribute highly (Variable influence on project (VIP) > 1) to a T1D signature. Colors depict clinical study groups and ellipses demarcate the spread of individuals within each group. Explained variance for first two principal components (PC1 and PC2) is indicated on the respective X- and Y- axis. Global distribution of the participants from each clinical group is shown as a density plot in the secondary Y-axis. (B) Univariate analysis (volcano plot) depicting differential circulating polar metabolite abundances between healthy and T1D individuals. Significantly contrasted (FDR < 10%) polar metabolites are depicted in red, with increasing effects in direction of controls (right). (C) Functional metabolic pathway identification comparing T1D and healthy controls and depicting enriched metabolic pathways: annotations of top polar metabolites using the human metabolome database (HMDB). Bars have been ordered and colored by the enrichment p-value score. (D) Univariate analysis (volcano plot) depicting differential abundances of serum lipid cluster between healthy and T1D individuals. Significantly contrasted (FDR < 10%) lipid clusters are colored in red with increasing effects in direction of controls (right). (E) Triglyceride (TG) species associated with different T1D albuminuria groupings (compared to healthy controls) based on the number of carbon atoms (Y-axis) and the number of double bonds (X.axis) present in the chemical structure. Blue-to-red gradient heatmap suggests directionality of the association (negative to positive). Significant associations are indicated in each cell with the following symbols: + p<0.1, X p<0.05, *p<0.01.

