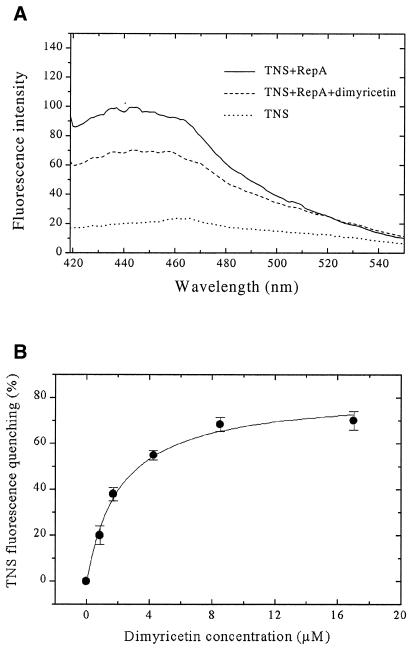
Figure 5.
Results of fluorescence studies on dimyricetin binding to RepA. (A) Fluorescence emission spectra: dotted curve, 100 µM TNS alone; continuous curve, in the presence of 2 µM RepA (monomer); dashed curve, in the presence of RepA and 2 µM dimyricetin. (B) Fluorescence titration studies on binding of dimyricetin to RepA. Titrations in buffer C at 25°C with increasing amounts of dimyricetin to the mixture of RepA and TNS. The measurements were monitored by the quenching of TNS (100 µM) fluorescence at λex = 400 nm, λem = 440 nm. RepA concentration was 2 µM (monomer).

