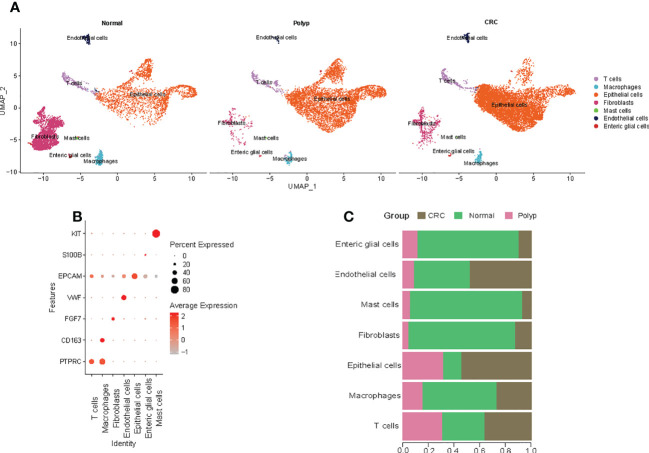
Figure 1.
Cell types in the colon tissue from normal individuals, patients with polyps, and adenomas. (A) The UMAP plots of cell types from six samples. (B) Dot plot of the proportion of cells in the respective cluster expressing selected marker genes. (C) The bar plot shows the fraction of cells originating from the different samples.

