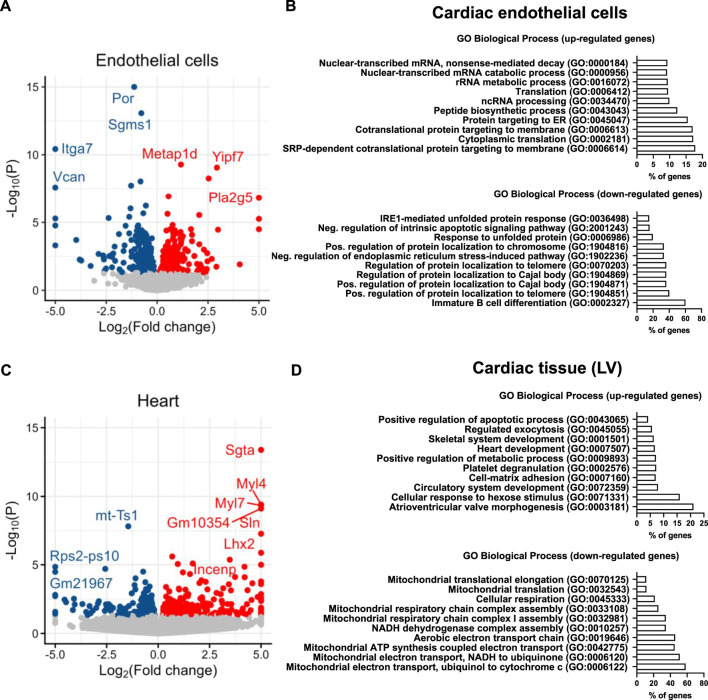
FIGURE 2.
RNA-sequencing of isolated cardiac endothelial cells and left ventricle. (A) Volcano plot summarizing the significantly altered genes in EC. n = 3 (pool of 2 different animals, genes were plotted according to p-value). (B) Ontology analysis (GO Biological Process, 2021; Chen et al., 2013; Kuleshov et al., 2016; Xie et al., 2021) for the top 500 up and downregulated genes of cardiac ECs. Bars represent the percentage of overlapping genes from the top ten analyzed ontologies. (C) Volcano plot summarizing the significantly altered genes in the heart. n = 3. (D) Ontology analysis (GO Biological Process, 2021; Chen et al., 2013; Kuleshov et al., 2016; Xie et al., 2021) for the top 200 up and downregulated genes of the left ventricle. Bars represent the percentage of overlapping genes from the top ten analyzed ontologies. n = 3. *p < 0.05.

