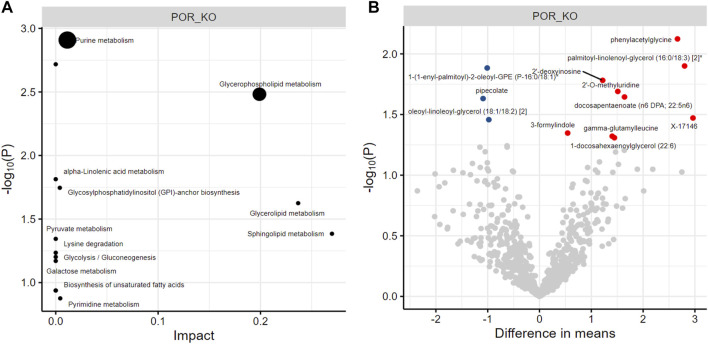
FIGURE 3.
Metabolomics of cardiac tissue. Pathway enrichment (A) and unique metabolites (B) which are significantly altered in cardiac tissue of ecPOR−/− mice as compared to CTL. Metabolites are represented as differential mean. Red: reduced and blue: increased in cardiac tissue of ecPOR−/− mice. n = 7.

