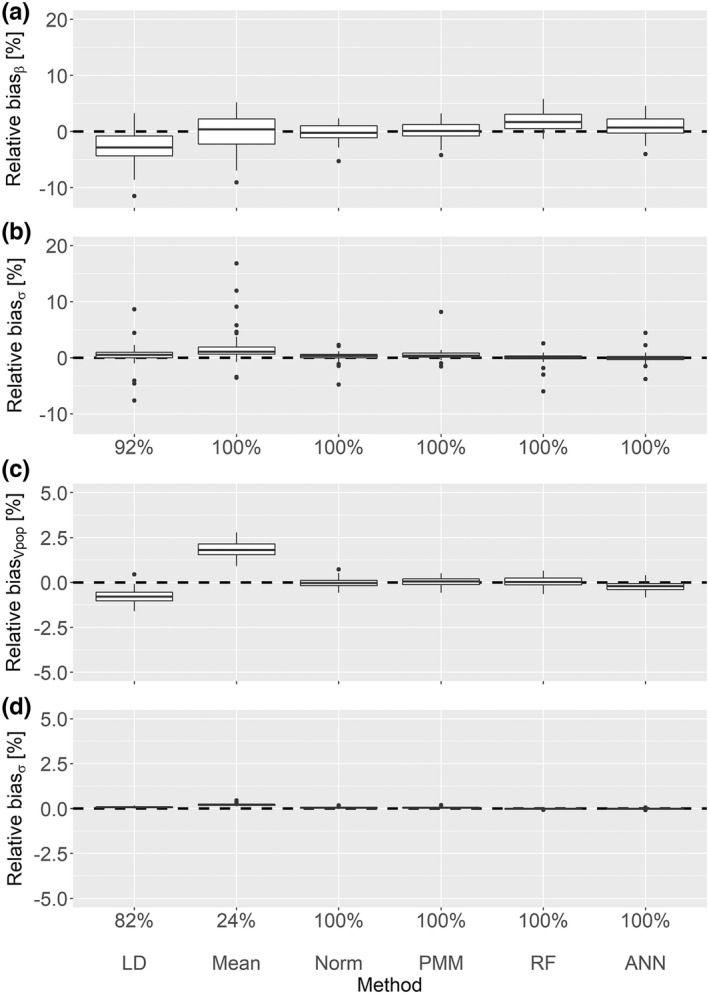
FIGURE 2.

Linear MAR scenario with 20% missing values. This plot shows the relative point estimate and standard error biases for the covariate effect (a, b) and the volume of distribution (c, d) with the corresponding coverage rates. ANN, artificial neural network; LD, listwise deletion; MAR, missing at random; PMM, predictive mean matching; RF, random forest.
