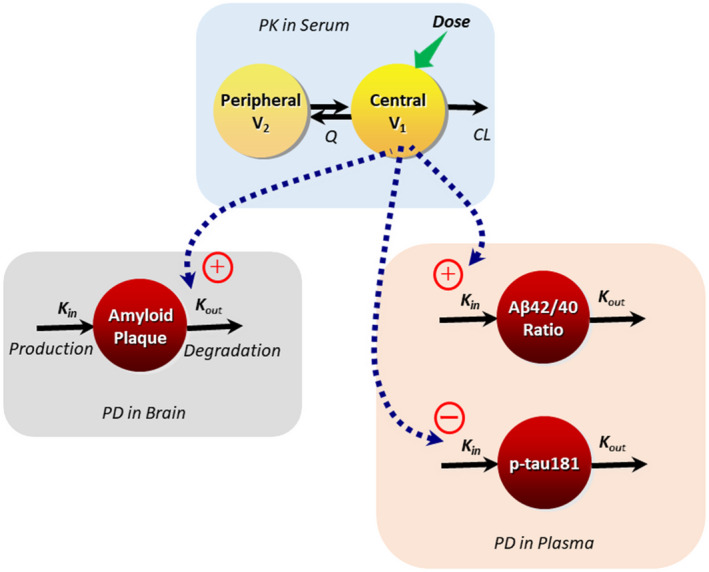
FIGURE 1.

Schematic of the population PK and PK/PD models for lecanemab. CL, clearance; K in, zero‐order rate constant for production of biomarker; K out, first‐order rate constant of degradation of biomarker; PD, pharmacodynamic; PK, pharmacokinetic; Q, intercompartmental clearance; V 1, central volume of distribution; V 2, peripheral volume of distribution. The equation for standard uptake ratio (SUVr) PK/PD model is presented below: Estimated parameters included baseline SUVr, the zero‐order production rate constant of amyloid plaque (K in), maximum exposure effect (E max), and lecanemab concentration resulting in half of the maximum drug effect (EC50), where K out = K in/baseline. The equations for Aβ42/40 ratio and p‐tau181 models are presented below: For both Aβ42/40 ratio and p‐tau181 estimated parameters included baseline, first order degradation rate constant of biomarker (K out) and slope for exposure effect, where K in = K out * baseline.
