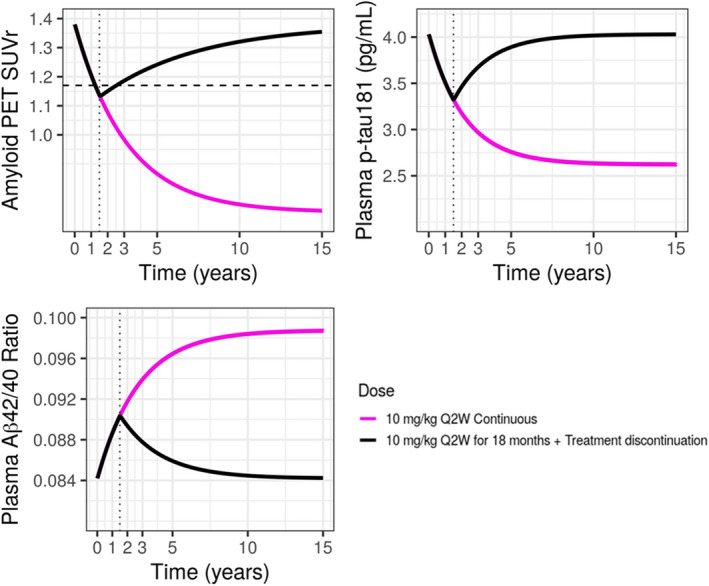
FIGURE 5.

Model‐predicted SUVr and plasma Aβ42/40 ratio and p‐tau181 following continuous 10 mg/kg biweekly with or without treatment discontinuation. Black horizontal dashed line in SUVr plot represents SUVr = 1.17, indicating amyloid negative line. Black vertical dotted lines represent time = 1.5 years (18 months). Pink solid line: continuous 10 mg/kg biweekly for 15 years, black solid line: 10 mg/kg biweekly for 18 months followed by treatment discontinuation. PET, positron emission tomography; SUVr, standard uptake ratio.
