
FIGURE 2.
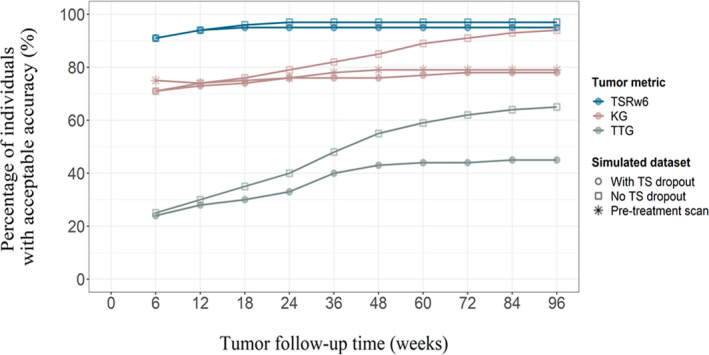
The percentage of individuals in the patient population with adequate accuracy of model‐predicted tumor metrics. The accuracy while assuming no dropout from tumor follow‐up (squares) and while considering dropout due to disease progression (20% increase from tumor nadir, circles) are shown for TSRw6 (blue), KG (rose) and TTG (gray). The effect of a pretreatment scan in predicting kG (red) due to disease progression is shown in stars. kG, tumor growth rate; TS, tumor size; TSRw6, tumor size ratio week 6; TTG, time‐to‐tumor growth