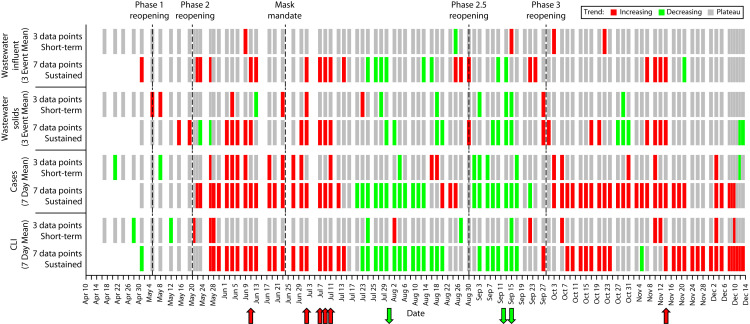
FIGURE 4—
Linear Regression Rolling Trend Classifications Illustrating Short-Term (Approximately 1 Week) and Sustained (Approximately 2 Weeks) Trends: Raleigh, NC, Sewershed, April 10–December 13, 2020
Note. CLI = COVID-like illness. Data were smoothed via rolling 7-day averages for cases and CLI and via 3-sampling-event averages for wastewater influent and solids. Statistically significant (P < .05) trends are shown in red (increasing) or green (decreasing). Color is placed on the last day of the 3- or 7-point period used in the regression. For lab-confirmed cases, specimen collection date was used. Arrows indicate periods of sustained trends for which there was agreement across the 4 surveillance data sets: the periods ending June 11, July 2, July 7, July 9, July 11, and November 14 (increases; red arrows) and the periods ending August 1, September 12, and September 15 (decreases; green arrows).

