. 2022 Oct 11;82(24):4641–4653. doi: 10.1158/0008-5472.CAN-22-0112

Figure 1.

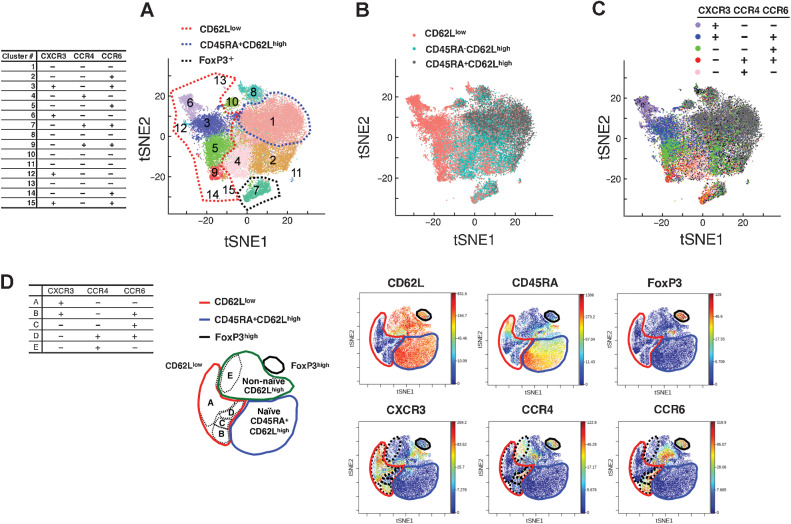
Figure 1. Clustering of CD4+ T cells according to scRNA-seq. A, tSNE plots derived from integrated gene expression data from scRNA-seq of 6 patients with lung cancer collected prior to pembrolizumab therapy. All 33,604 CD3+CD8−CD4+ cells were divided into 15 clusters upon unsupervised clustering. The red dashed line indicates the extent of clusters mostly composed of CD62Llow T cells (cluster #3, #5, #6, #9, #12, #13, #14, and #15). The blue dashed line indicates cluster #1—mostly composed of CD62LhighCD45RA+ T cells. The table shows the expression levels of the CXCR3, CCR4, and CCR6 proteins in each cluster as determined by the value of TotalSeq-C (Fig. 1C). B and C, Cell-level annotation of B: CD62L, CD45RA, and C: CXCR3, CCR4, and CCR6 from scRNA-seq of 6 patients (same tSNE reduction as in A). Annotation was performed according to the TotalSeq-C counts of each cell, in the gating method. The gating strategy is detailed in Supplementary Fig. S2. D, Representative illustrations of mass cytometry viSNE analysis for gated CD4+CD3+ cells observed after the expression of 21 molecules and the expressions of six molecules are presented. The red lines indicate the extent of the region representing the CD62Llow subpopulation. The blue lines indicate the CD45RA+CD62Lhigh region. The black lines indicate the FoxP3+ region. The green line indicates the remaining region. The black dashed lines indicate the five regions mapped on the basis of CXCR3, CCR4, and CCR6 expression. The chemokine receptor expression patterns in each region are presented in the table.

Clustering of CD4+ T cells according to scRNA-seq. A, tSNE plots derived from integrated gene expression data from scRNA-seq of 6 patients with lung cancer collected prior to pembrolizumab therapy. All 33,604 CD3+CD8CD4+ cells were divided into 15 clusters upon unsupervised clustering. Red dashed line, the extent of clusters mostly composed of CD62Llow T cells (cluster #3, #5, #6, #9, #12, #13, #14, and #15). Blue dashed line, cluster #1—mostly composed of CD62LhighCD45RA+ T cells. The table shows the expression levels of the CXCR3, CCR4, and CCR6 proteins in each cluster as determined by the value of TotalSeq-C (C). B and C, Cell-level annotation of CD62L, CD45RA (B) and CXCR3, CCR4, and CCR6 (C) from scRNA-seq of 6 patients (same tSNE reduction as in A). Annotation was performed according to the TotalSeq-C counts of each cell in the gating method. The gating strategy is detailed in Supplementary Fig. S2. D, Representative illustrations of mass cytometry viSNE analysis for gated CD4+CD3+ cells observed after the expression of 21 molecules and the expressions of six molecules are presented. Red lines, the extent of the region representing the CD62Llow subpopulation. Blue lines, CD45RA+CD62Lhigh region. Black lines, FoxP3+ region. Green line, remaining region. Black dashed lines, the five regions mapped on the basis of CXCR3, CCR4, and CCR6 expression. The chemokine receptor expression patterns in each region are presented in the table.