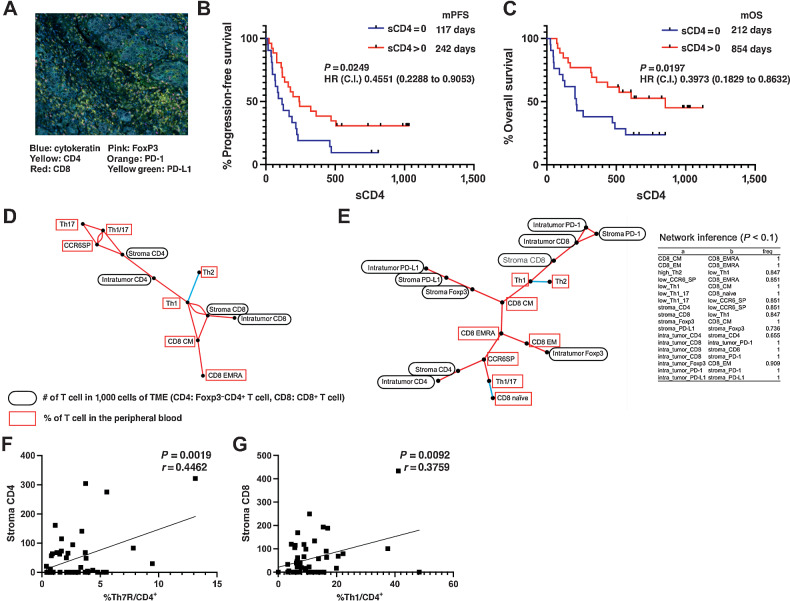
Figure 6.
Correlation of T cells in the TME with clinical outcome after PD-1 blockade therapy and network analysis among T cells in the peripheral blood and TME. A, Representative multiplex IHC analysis results. Formalin-fixed and paraffin-embedded sections of biopsy or resected samples from NSCLC specimens were stained for CD4, CD8, Foxp3, PD-1, PD-L1, and cytokeratin with OPAL. Stained sections were imaged using the Vectra Automated Imaging System. The distribution of tumor cells (blue; cytokeratin) and PD-L1 (membranous; yellow-green) or infiltrating CD4+ T cells (yellow), CD8+ T cells (red), Foxp3+ T cells (pink), and PD-1+ T cells (orange) are shown. B and C, The Kaplan–Meier analysis of PFS (B) and OS (C) after pembrolizumab therapy in previously untreated NSCLC cohort for whom IHC analysis of tumor tissues was available (n = 46). Red line, group that had one or more FoxP3−CD4+ cells in the tumor stroma; blue line, group that had less than one. C.I., 95% confidence interval; HR, hazard ratio; mOS, median overall survival; mPFS, median progression-free survival. C, Results of the linear regression analysis of peritumoral stromal CD4+ cell counts and PFS of patients with lung cancer treated with pembrolizumab as first-line therapy. D, Correlation coefficients between T-cell subpopulations with FDR < 0.01 were drawn in network form. The positive and negative correlations between the subpopulations are depicted by the red and blue lines, respectively. E, The network of 18 cell clusters was inferred with a modified path consistency algorithm based on the cell fraction data in the peripheral blood and the microenvironment. The inference was performed 1,000 times, and the connection established more than 500 times was set to be significant in this analysis. The cell clusters with positive and negative correlations are connected by red and blue lines, and the fractions of established correlations by 1,000 inferences are indicated on each line. F, Correlation between peripheral blood Th7R metacluster percentage and tumor-stromal CD4+ T-cell count. G, Correlation between peripheral blood CD62Llow Th1 cell percentage and tumor-stromal CD8+ T-cell count.

