. 2022 Nov 10;82(24):4571–4585. doi: 10.1158/0008-5472.CAN-22-0435

Figure 4.

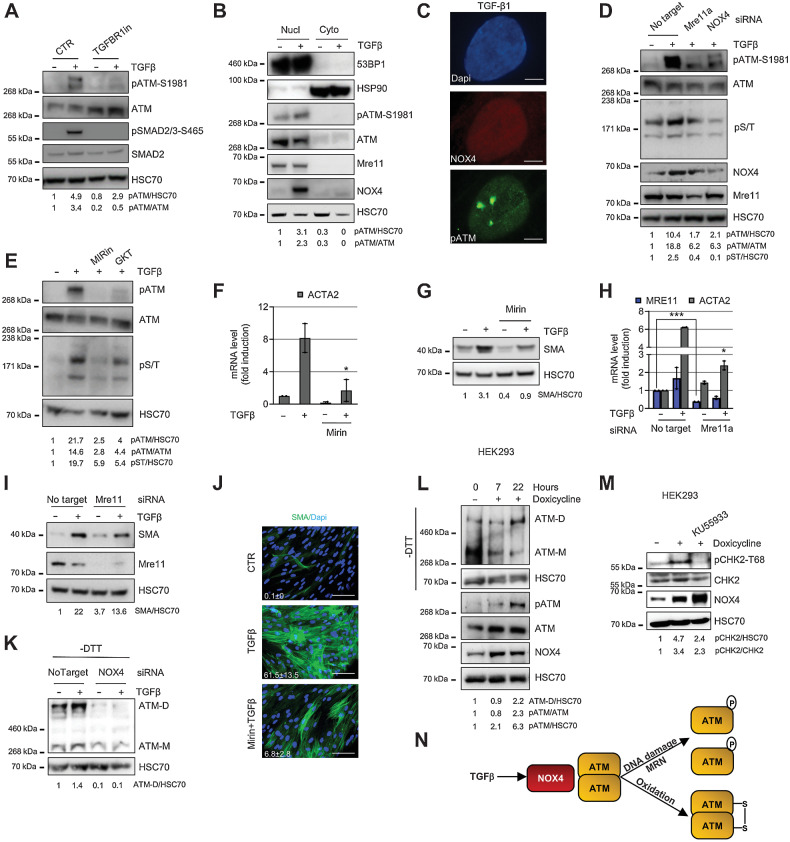
Figure 4. TGFβ activates ATM via NOX4-driven DNA damage/MRN complex and oxidation. A–E, HFFF2 were treated with TGFβ1 for 24 hours. A, Western blotting/quantification of HFFF2 treated with TGFβR1 inhibitor; B, Western blotting/quantification of nucleus/cytoplasm extracts using HSP90 and 53BP1 as cytoplasmic and nuclear marker, respectively. C, Representative immunofluorescence staining for NOX4 and pATM (scale bar = 5 μm). D, Western blotting/quantification of HFFF2 transfected as indicated. E, Western blotting/quantification of HFFF2 treated with inhibitors of MRE complex inhibitor (Mirin, 40 μmol/L) or NOX4 (GKT137831; 40 μmol/L). F–G, qRT-PCR (F; ntr = 3) and Western blotting/quantification (G) of HFFF2-treated TGFβ1 for 72 hours ± 40 μmol/L Mirin. H and I, qRT-PCR (H; ntr = 3) and Western blotting/quantification (I) of IMR90 fibroblasts transfected as indicated and treated with TGFβ1 for 72 hours. J, Representative immunofluorescent staining of SMA-positive stress fibers and relative quantification of the mean in HFFF2 treated with TGFβ1 for 72 hours ± Mirin (40 μmol/L; scale bar = 100 μm; FoV = 10). K, Western blotting/quantification of HFFF2 transfected as indicated and treated with TGFβ1 for 48 hours; gel run in nonreducing -Dithiothreitol (DTT) conditions for ATM dimer (ATM-D). L, Western blotting/quantification (±DTT) of NOX4-inducible HEK-293 cells treated with doxycycline over time. M, Western blotting/quantification of NOX4-inducible HEK-293 cells treated with doxycycline ± KU55933 for 22 hours. N, Schematic diagram of the main findings in the figure. Heteroscedastic Student t test is used in the figure and refers to the TGFβ1-treated samples unless otherwise highlighted.

TGFβ activates ATM via NOX4-driven DNA damage/MRN complex and oxidation. A–E, HFFF2 were treated with TGFβ1 for 24 hours. A, Western blotting/quantification of HFFF2 treated with TGFβR1 inhibitor. B, Western blotting/quantification of nucleus/cytoplasm extracts using HSP90 and 53BP1 as cytoplasmic and nuclear marker, respectively. C, Representative immunofluorescence staining for NOX4 and pATM. Scale bar, 5 μm. D, Western blotting/quantification of HFFF2 transfected as indicated. E, Western blotting/quantification of HFFF2 treated with inhibitors of MRE complex inhibitor (Mirin, 40 μmol/L) or NOX4 (GKT137831; 40 μmol/L). F and G, qRT-PCR (ntr = 3; F) and Western blotting/quantification (G) of HFFF2-treated TGFβ1 for 72 hours ± 40 μmol/L Mirin. H and I, qRT-PCR (ntr = 3; H) and Western blotting/quantification (I) of IMR90 fibroblasts transfected as indicated and treated with TGFβ1 for 72 hours. J, Representative immunofluorescent staining of SMA-positive stress fibers and relative quantification of the mean in HFFF2 treated with TGFβ1 for 72 hours ± Mirin (40 μmol/L; scale bar, 100 μm; FoV = 10). K, Western blotting/quantification of HFFF2 transfected as indicated and treated with TGFβ1 for 48 hours; gel run in nonreducing -dithiothreitol (DTT) conditions for ATM dimer (ATM-D). L, Western blotting/quantification (±DTT) of NOX4-inducible HEK293 cells treated with doxycycline over time. M, Western blotting/quantification of NOX4-inducible HEK293 cells treated with doxycycline ± KU55933 for 22 hours. N, Schematic diagram of the main findings in the figure. Heteroscedastic Student t test is used in the figure and refers to the TGFβ1-treated samples unless otherwise highlighted. *, P ≤ 0.05; ***, P ≤ 0.001.