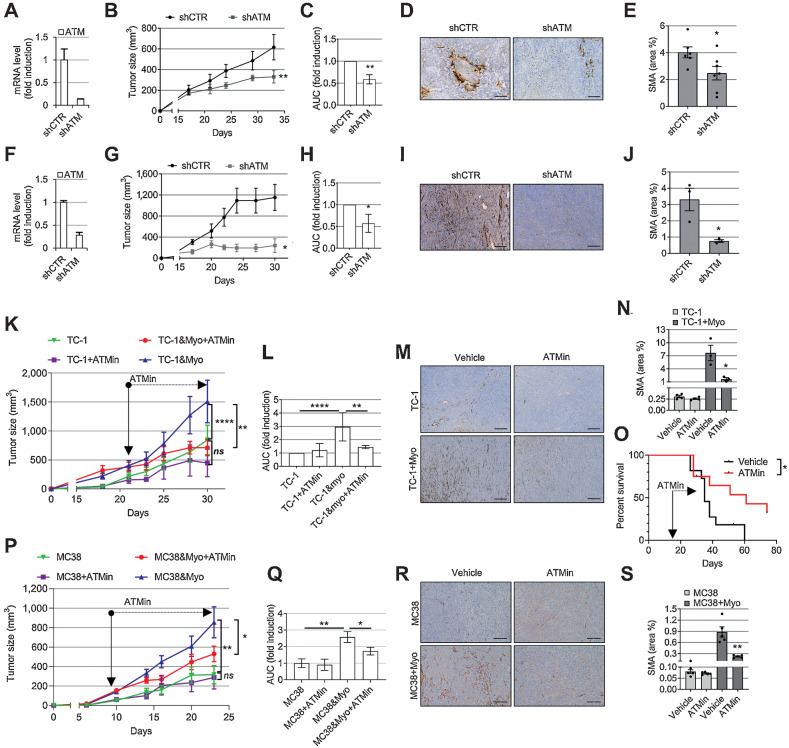
Figure 5.
Targeting ATM in myofibroblasts reduces their intratumoral accumulation and slows tumor growth. A and F, qRT-PCR showing shRNA ATM knockdown in HFFF2 (A) or TGFβ1-treated MLF (myoMLF; F) prior to injection in mice (ntr = 3; SD shown). B, G, C, and H, Tumor growth curves (B and G) and AUC histograms (C and H) following coinjection of tumor cells with shCTR or shATM fibroblasts (5PT cells + HFFF2, B and C; TC-1 cells + myoMLF, G and H). Data from single experiments are presented; mouse numbers = 3–8 (B and G). Two-way ANOVA is used for AUC analysis of three individual experiments for both 5PT (C) and TC-1 models (H). D and I, Representative SMA IHC from the experiments shown in B and G, respectively. E and J, Quantification of SMA staining (ntr = FoV = 3) from the experiments shown in B (E) and G (J). K, L,P, and Q, Mice injected with either TC-1 ± myoMLF (K and L) or MC38 ± TGFβ1-treated MCF (myoMCF; P and Q) were treated with ATM inhibitor AZD0156 for the duration of the experiment (mouse number = 5–8); tumor growth curves (K and P); AUC analysis of two experiments relative to K (two-way ANOVA; L); AUC analysis of the single experiment shown in P (homoscedastic Student t test; Q). M, N, R, and S, Representative images and quantification of SMA IHC of mouse tumors in K and P, respectively (ntr = FoV = 3). O, Overall survival of TC-1 + myoMLF mice treated daily with AZD0156 at days 15–28 (mouse number = 11–12; Mantel–Cox log-rank test is shown; see also Supplementary Fig. S5K and S5L). Homoscedastic Student t test is shown in the figure and refers to the control unless otherwise highlighted. Scale bars, 200 μm. ns, nonsignificant; *, P ≤ 0.05; **, P ≤ 0.01; ****, P ≤ 0.0001.

