Figure 3.
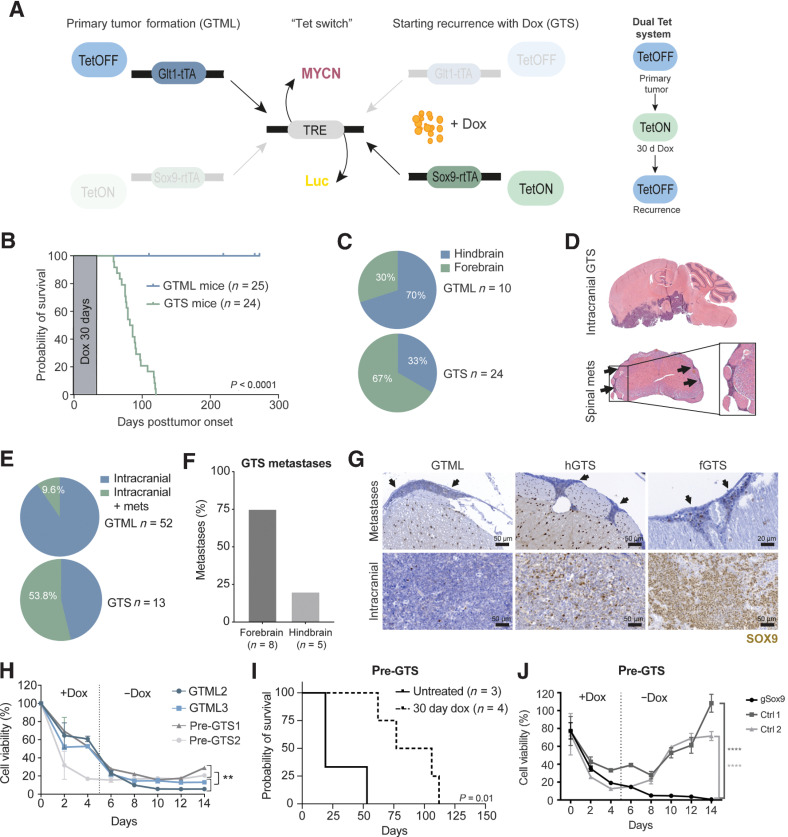
The recurrence process is SOX9-dependent and reproduced in a novel dual Tet transgenic GTS model. A, Schematics of the GTS recurrence model. Left, primary tumor formation (GTML). In the absence of dox, the TML (TRE-MYCN-Luc) transgene is expressed in Glt1-positive cells (bidirectional expression), leading to MB primary tumor formation in the GTML model. Dox administration will halt MYCN expression (TetOFF) in the Glt1-positive cell population. Right, starting recurrence with dox (GTS). When combining the GTML TetOFF model with the TetON model, dox will simultaneously force the expression of the TML transgene in Sox9-expressing cells. When the primary tumor is presented, mice are given a 30-day dox regimen (the Tet-switch), at which time, the TetON system is active. Mice are then taken off dox to reactivate the TetOFF system and followed for tumor recurrence. B, Kaplan–Meier plot and scheme of dox treatment showing mouse survival in the GTS recurrence model. Primary tumor (GTML, TetOFF-driven) was treated with and cured after 30 days of dox administration. Tumors recurred after 45 to 120 days post-primary tumor onset/start of dox treatment (Log-rank Mantel–Cox test; P < 0.0001). C, Quantification of tumor localization in the GTML and GTS models. Seventy percent of GTS recurrences were located in the mouse forebrain in contrast to GTML tumors that most often are found in the hindbrain. D, H&E staining of a whole mouse brain with relapsed GTS tumor. The tumor recurrences were most often situated in the forebrain. Spinal cord metastasis can be found in GTS-relapsed tumors. Arrows, metastatic cells surrounding the spinal cord. E, Only 9.6% of H&E-stained sectioned spinal cords from GTML samples presented with spinal metastases (mets) as compared with 53.8% in GTS samples. F, Histogram comparing the occurrence of spinal metastases in GTS recurrences in the hindbrain or forebrain region. The majority of spinal metastases were found in forebrain relapse specimens. G, SOX9 in disseminated tumor cells in corresponding spinal cords from representative individual mice with metastatic spread (top; arrows) as compared with SOX9-positive cells in primary GTML, hGTS, and fGTS tumors (bottom). H, Cell viability (Alamar blue) of GTML versus pre-GTS cells under long-term dox treatment. Pre-GTS cells started to recover after dox treatment in vitro, but GTML cells did not (Mann–Whitney; **, P < 0.01). I, Kaplan–Meier plot showing survival probability of nude mice injected with pre-GTS1 and 2. Pre-GTS cells gave rise to primary tumors that were treated with dox for 30 days. The tumors later relapsed (log-rank Mantel–Cox test; P = 0.01). J, Cell viability (Alamar blue) of CRISPR-Cas9 edited and control pre-GTS1 cells under long-term dox treatment in vitro. Control cells started to recover after dox treatment, but Sox9-edited pre-GTS1 cells (sgSox9) did not. Unpaired t test; ****, P < 0.0001. See also Supplementary Fig. S3.

