. 2022 Oct 11;82(24):4586–4603. doi: 10.1158/0008-5472.CAN-22-2108

Figure 4.

Figure 4. Recurrent MBs molecularly resemble primary MBs, are more inflammatory and immune evasive. A, PCA plot showing the affiliation of primary GTML tumors and recurrent GTS tumors with expression profiles of MB subgroups (data from refs. 15, 25) Northcott and MB PDXs (18) following cross-platform projection via the Metagene (23) Tamayo method. B, GSEA results for 32 selected key gene sets from six pathway categories significantly enriched in either the GTS (green) or GTML tumors (blue). C and D, Single-cell sequencing read counts for MYCN and Sox9 in GTML (C) and GTS (D), indicating that the percentage of MYCN-positive (reads ≥ 2) cells remains largely unchanged between the two tumor models, whereas the GTS tumor reveals an increased percentage of Sox9 expressing cells. See also Supplementary Fig. S4 and Supplementary Table S2. E, Dot plots of transgenic MYCN and murine Sox9, Mki67, and Slc1a2 gene expression in GTML (left) and GTS (right) cell lines. Cluster IDs are indicated along the y-axis. The size of the dot indicates how many % of cells in the cluster express the gene and the color intensity indicates the average expression level in the cluster. F, Enrichment plots of pathways significantly altered in 48-hour dox-treated pre-GTS tumor cells (grey) compared with 48-hour dox-treated GTML tumor cells (blue). G, Bar plots showing the logFC for selected genes from the gene sets depicted in F as calculated by edgeR between GTML and pre-GTS cells under dox treatment. See also Supplementary Fig. S4 and Supplementary Tables S3 and S4.

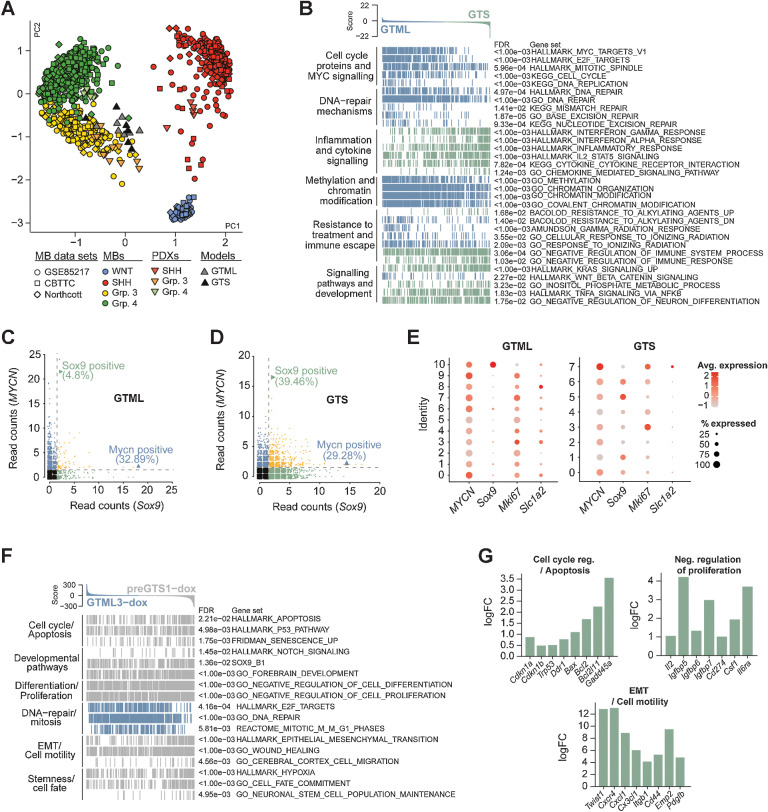
Recurrent MBs molecularly resemble primary MBs and are more inflammatory and immune evasive. A, PCA plot showing the affiliation of primary GTML tumors and recurrent GTS tumors with expression profiles of MB subgroups (data from refs. 15, 25) Northcott and MB PDXs (18) following cross-platform projection via the Metagene (23) Tamayo method. B, GSEA results for 32 selected key gene sets from six pathway categories significantly enriched in either the GTS (green) or GTML (blue) tumors. C and D, Single-cell sequencing read counts for MYCN and Sox9 in GTML (C) and GTS (D), indicating that the percentage of MYCN-positive (reads ≥ 2) cells remained largely unchanged between the two tumor models, whereas the GTS tumor revealed an increased percentage of Sox9-expressing cells. See also Supplementary Fig. S4 and Supplementary Table S2. E, Dot plots of transgenic MYCN and murine Sox9, Mki67, and Slc1a2 gene expression in GTML (left) and GTS (right) cell lines. Cluster IDs are indicated along the y-axis. The size of the dot indicates the percentage of cells in the cluster that expressed the gene, and the color intensity indicates the average expression level in the cluster. F, Enrichment plots of pathways significantly altered in 48-hour dox-treated pre-GTS tumor cells (gray) compared with 48-hour dox-treated GTML tumor cells (blue). G, Bar plots showing the logFC for selected genes from the gene sets depicted in F as calculated by edgeR between GTML and pre-GTS cells under dox treatment. See also Supplementary Fig. S4 and Supplementary Tables S3 and S4.