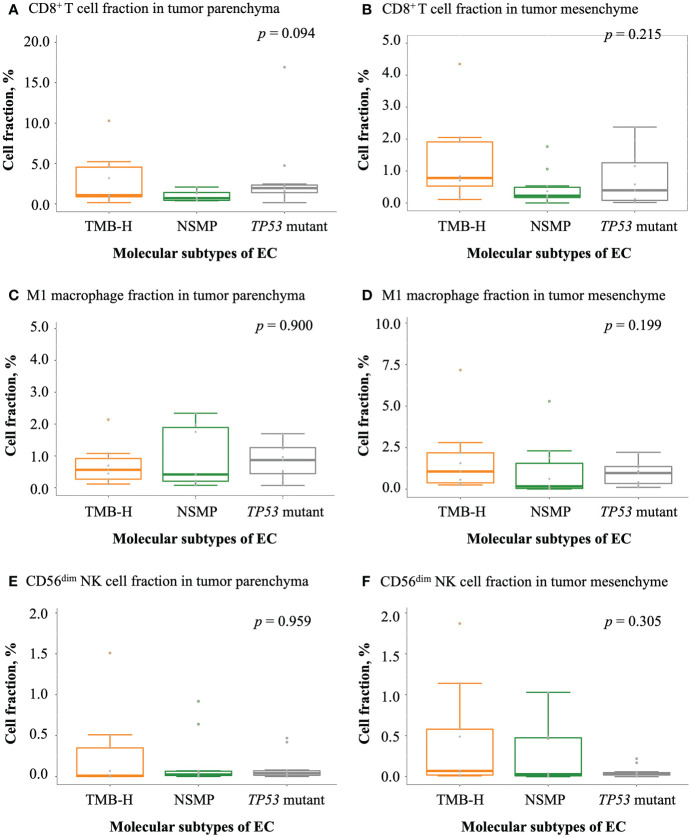
Figure 4.
Infiltration of antitumor-related immune cells in EC. (A, B) CD8+ T cell fractions in tumor parenchyma and mesenchyme. (C, D) M1 macrophage fractions in tumor parenchyma and mesenchyme. (E, F) CD56dim NK cell fractions in tumor parenchyma and mesenchyme. For (A-F), the p values of Kruskal-Wallis test for overall comparisons are given. In all panels, n = 9 for TMB-H, 10 for NSMP, 11 for TP53 mutant. The dots above the boxplots indicate outliers. TMB-H, high tumor mutation burden; NSMP, no specific molecular profile; EC, endometrial cancer; CD56dim NK cell, CD56 dimly stained natural killer cell.

