Figure 5.
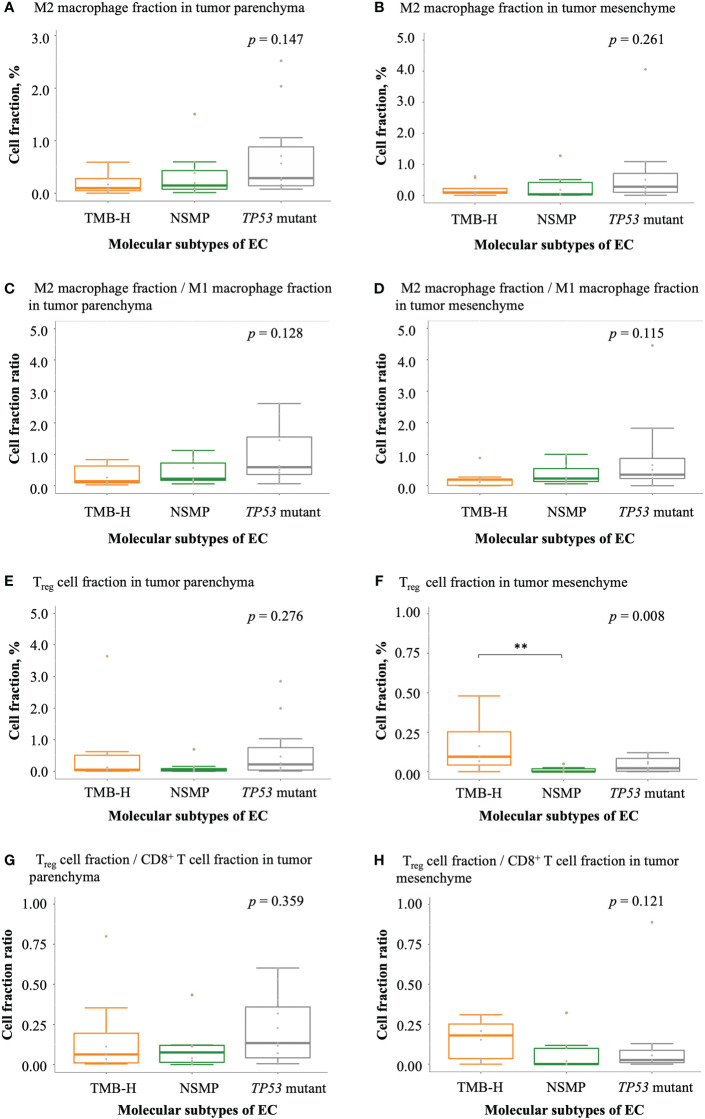
Infiltration of negatively regulatory immune cells in EC. (A, B) M2 macrophage fractions in tumor parenchyma and mesenchyme. (C, D) The ratio of M2 macrophage fractions to M1 macrophage fractions in tumor parenchyma and mesenchyme. (E, F) Treg cell fractions in tumor parenchyma and mesenchyme. (G, H) The ratio of Treg cell fractions to CD8+ T cell fractions in tumor parenchyma and mesenchyme. The p values of Kruskal-Wallis test for overall comparisons are given, and significant levels in pairwise comparisons are shown in the figure. In all panels, n = 9 for TMB-H, 10 for NSMP, 11 for TP53 mutant. The dots above the boxplots indicate outliers. TMB-H, high tumor mutation burden; NSMP, no specific molecular profile; EC, endometrial cancer; Treg cell, regulatory T cell. **p < 0.01.

