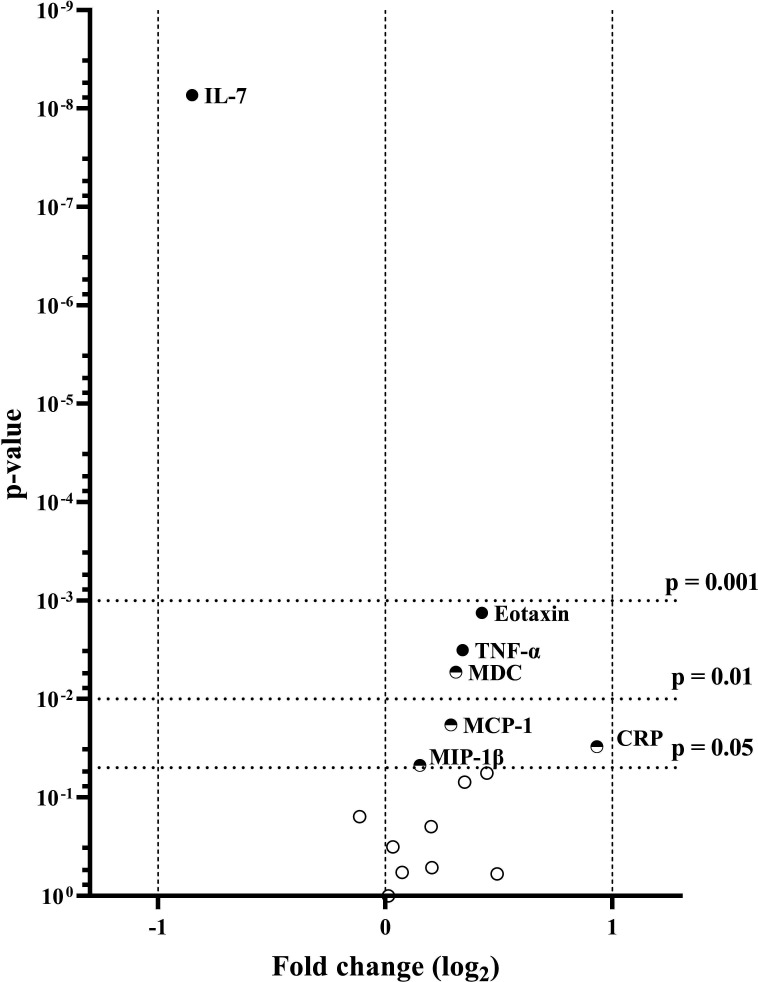
Figure 1.
Volcano plot displaying pairwise comparisons of inflammatory factors in type 2 diabetes and healthy controls. Vertical dashed lines indicate threshold for twofold differences among groups. Horizontal dashed lines indicate p value thresholds of 0.05, 0.01 and 0.001, respectively. ●Significantly different after adjustment for age and BMI, ◓significantly different in the unadjusted model,○ above significance threshold in both models. Only significant analytes are labelled. BMI, body mass index; CRP, C reactive protein; IL, interleukin; MDC, macrophage-derived chemokine; MIP, macrophage inflammatory protein; TNF, tumour necrosis factor.

