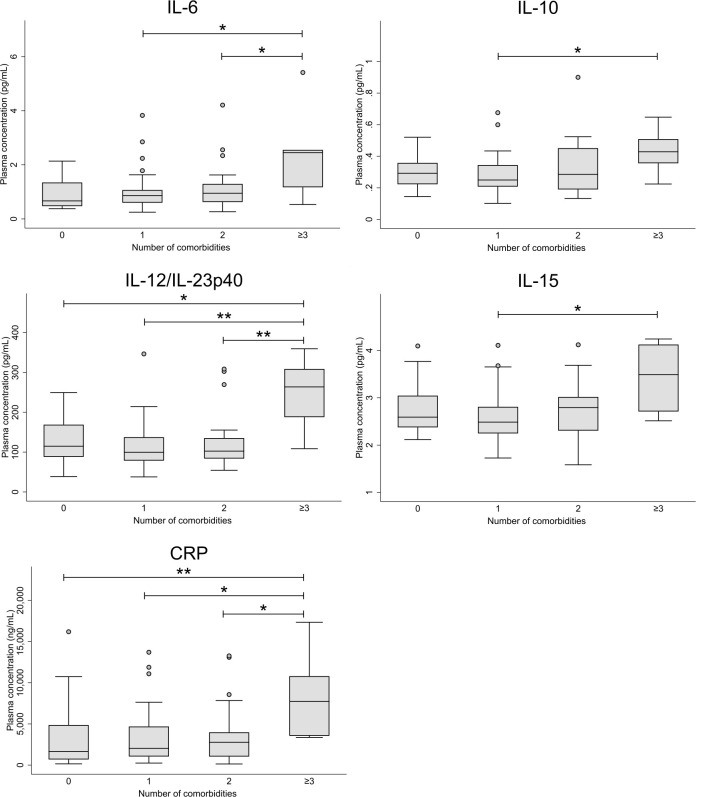
Figure 2.
Box plots displaying plasma concentrations of biomarkers in individuals with type 2 diabetes and 0 (n=20), 1 (n=43), 2 (n=28), or 3 or more (n=7) diabetic comorbidities (retinopathy, nephropathy, neuropathy, cardiac autonomic neuropathy). Only analytes with p values below 0.05 are shown. *P<0.05, **p<0.01. CRP, C reactive protein; IL, interleukin.

