Figure 4 .
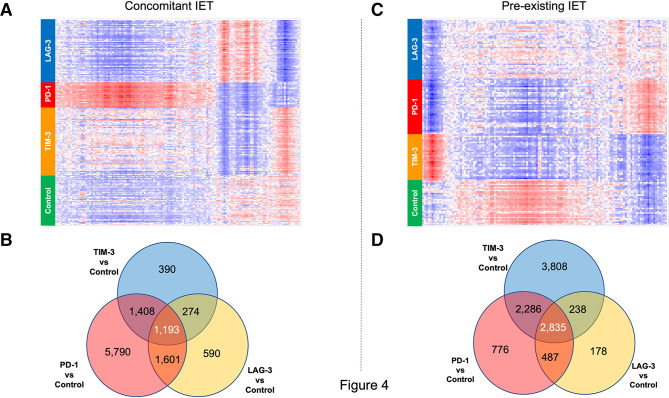
Different immune checkpoint inhibitors (ICIs) have both distinct and shared effects on the gene expression profile of thyroidal CD45+ cells. Differential gene expression analysis from CD45+ cells isolated from the thyroid of experimental animals. (A, B) Data collected from the analysis of animals in the concomitant IET experimental arm. (C, D) Data collected from the analysis of animals in the pre-existing IET experimental arm. (A, C) Hierarchical clustering/heatmap of genes differentially expressed with FDR <0.05 and fold change >1.5 between animals treated with anti-PD-1 and controls. The heatmaps show that the effect of the 3 different ICIs on this set of genes is different for each ICI, both in the concomitant IET experimental arm and in the pre-existing IET experimental arm. Red indicates upregulation and blue indicates downregulation. (B, D) Venn diagram analysis of genes differentially expressed with FDR<0.05 between anti-TIM-3 (TIM-3) treated cells and isotype control (Iso), anti-PD-1 (PD-1) treated cells and isotype control, and anti-LAG-3 treated cells (LAG-3) and isotype control. The Venn diagram shows that only a fraction of the genes modulated by each ICI is modulated by all ICIs. This observation was consistent across the two experimental arms. IET, iodine exacerbated thyroiditis; PD-1, programmed death-1; LAG-3, lymphocyte activation gene 3; TIM-3, T-cell immunoglobulin and mucin domain 3.

