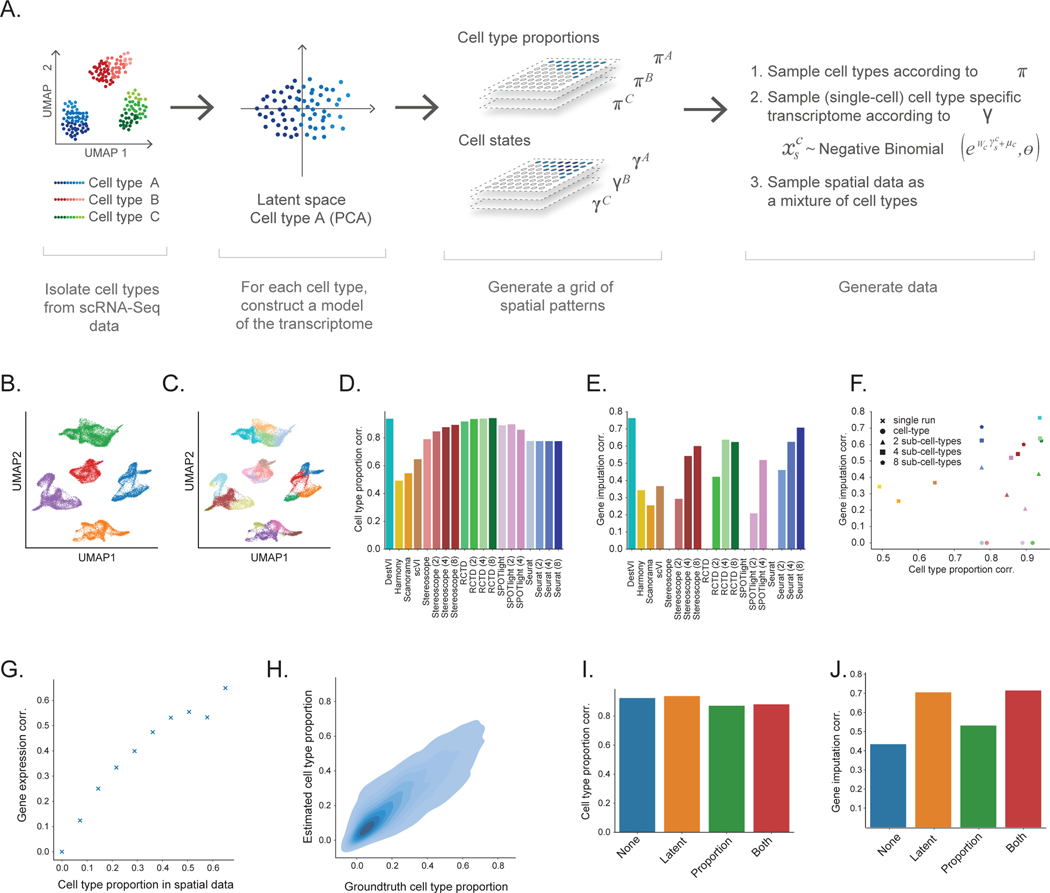
Figure 2: Evaluating the performance on DestVI on simulations.
(A) Schematic view of the semi-simulation framework. For each cell type of a scRNA-seq dataset, we learned a continuous model of cell. We sampled spatially-relevant random vectors on a grid to encode the proportion of every cell type in every spot , as well as the cell-type-specific embeddings . Then, we feed those parameters into the learned continuous model to generate ST data (Methods). (B-C) Visualization of the single-cell data, and the cell state labels used for comparison to competing methods (UMAP embeddings of the single-cell data; 32,000 cells). (B) Cells are colored by cell type. (C) Cells are colored by the sub-cell types, obtained via hierarchical clustering (5 clusters). (D-F) Comparison of DestVI to competing algorithms, possibly applied to different clustering resolutions. Performance is not reported for cases that did not terminate by three hours (SPOTLight with 8 sub-clusters; Methods). (D) Spearman correlation of estimated CTP compared to ground truth for all methods. (E) Spearman correlation of estimated cell-type-specific gene expression compared to ground truth, for combinations of spot and cell type for which the proportion is > 0.4 for the parent cluster (not applicable to algorithms run at the coarsest level, as they do not provide cell type proportions at any sub cell type level). (F) Scatter plot of both metrics, that shows the tradeoff reached by all methods. Colors in this panel are in concordance with the ones from panel (E-F). (G-H) Follow-up stress tests for DestVI. (G) Accuracy of imputation, measured via Spearman correlation as a function of the cell-type proportion in a given spot. (H) Head-to-head comparison of estimated cell-type proportion against ground truth across all spots and cell types (8,000 combinations of spot and cell type). (I-J) Ablation studies for the amortization scheme used by DestVI. “None” stands for vanilla MAP inference. “Latent” and “Proportion” refer to only the inference of the latent variables, and only the cell type abundance being amortized with a neural network, respectively. “Both” refers to fully-amortized MAP inference. (I) Spearman correlation of estimated CTP compared to ground truth. (J) Spearman correlation of estimated cell-type-specific gene expression compared to ground truth.

