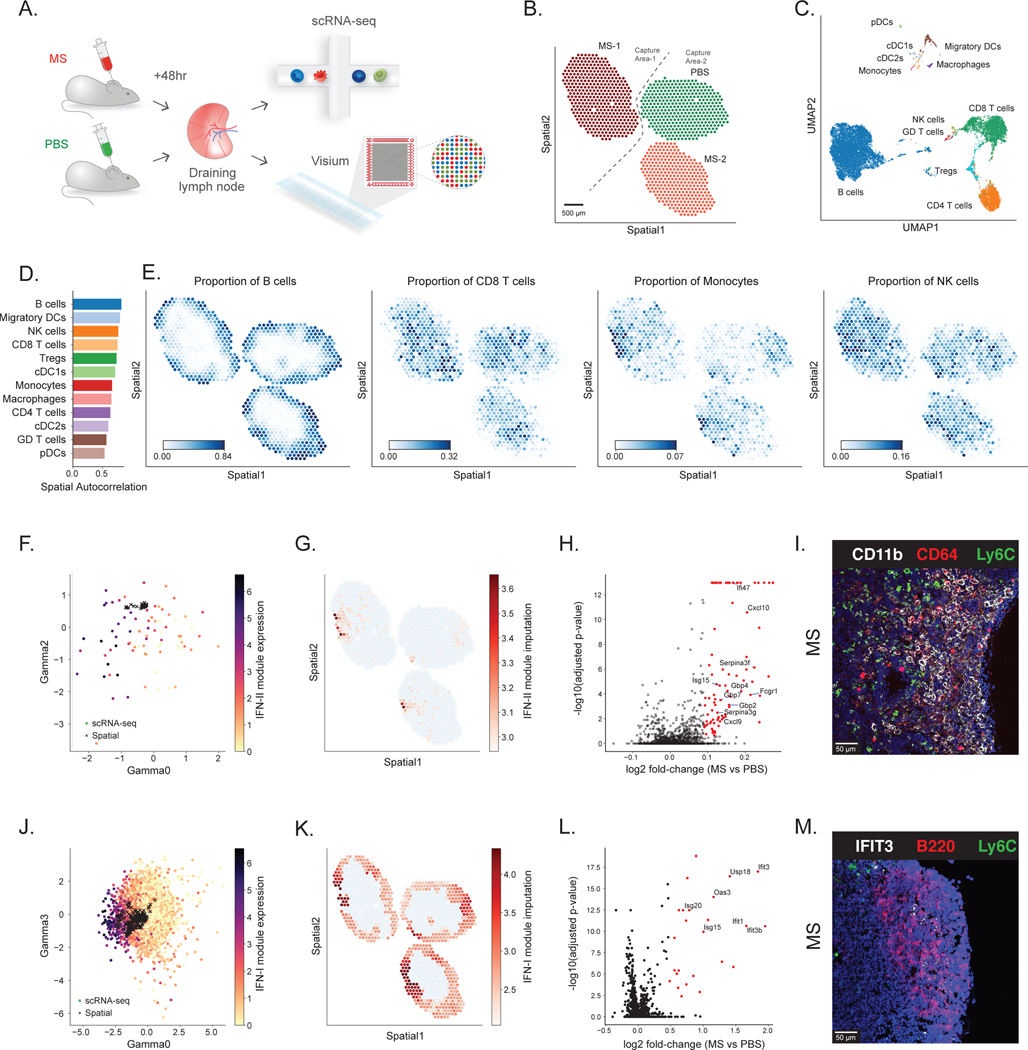
Figure 3: Application of DestVI to the murine lymph nodes.
(A) Schematics of the experimental pipeline. We processed murine lymph nodes with ST (10x Visium) and single-cell RNA sequencing (10x Chromium) following 48 hr stimulation by Mycobacterium smegmatis (MS) compared with PBS control (two sections from each condition). (B) ST data (1,092 spots; only three sections passed the quality check) (Supplementary Methods). Sample MS-1 and samples PBS / MS-2 were processed on different capture areas of the same Visium gene expression slide. (C) UMAP projection of the scRNA-seq data (14,989 cells). (D) Spatial autocorrelation of the CTP. (E) Spatial distribution of CTP for B cells, CD8 T cells, Monocytes and NK cells, as inferred by DestVI. (F) Embedding of the monocytes (circles; 128 single-cells) alongside the monocytes-abundant spots (crosses; 79 spots). Single-cells are colored by expression of IFN-II genes identified by Hotspot (Fcgr1, Cxcl9 and Cxcl10; Supplementary Figures 12–14). (G) Imputation of monocyte-specific expression of the IFN-II marker genes for the monocytes-abundant spots of the spatial data (log-scale) (H) Monocyte-specific DE analysis between MS and PBS lymph nodes (2,000 genes; 79 spots; total 10,980 samples from the generative model). Red dots designate genes with statistical significance, according to our DE procedure (two-sided Kolmogorov-Smirnov test, adjusted for multiple testing using the Benjamini-Hochberg procedure; Methods). (I) Immunofluorescence imaging from a MS lymph node, staining for CD11b, CD64 and Ly6C in the interfollicular area (IFA). Scale bar, 50 μm. (J) Embedding of the B cells (circles, 8,359 single-cells) alongside the B-cells-abundant spots (crosses, 579 spots). Single-cells are colored by expression of the IFN-I genes identified by Hotspot (Ifit3, Ifit3b, Stat1, Ifit1, Usp18 and Isg15; Supplementary Figures 17–18). (K) Imputation of B cell-specific expression of the IFN-I gene module on the spatial data (log-scale), reported on B-cells-abundant spots. (L) B cell-specific DE analysis between MS and PBS lymph nodes (2,000 genes; 579 spots; 6,160 samples). Red dots designate genes with statistical significance, according to our DE procedure (two-sided Kolmogorov-Smirnov test, adjusted for multiple testing using the Benjamini-Hochberg procedure; Methods). (M) Immunofluorescence imaging from a MS lymph node, staining for IFIT3, B220 and Ly6C in B cell follicle near the inflammatory IFA. Scale bar, 50 μm.

