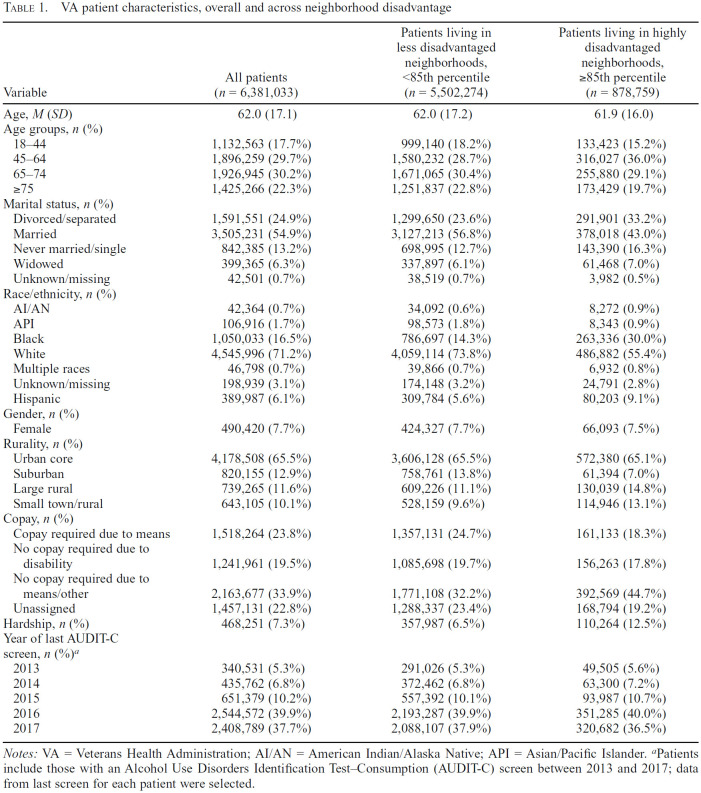
Table 1.
VA patient characteristics, overall and across neighborhood disadvantage
| Variable | All patients (n = 6,381,033) | Patients living in less disadvantaged neighborhoods, <85th percentile (n = 5,502,274) | Patients living in highly disadvantaged neighborhoods, ≥85th percentile (n = 878,759) |
|---|---|---|---|
| Age, M (SD) | 62.0 (17.1) | 62.0 (17.2) | 61.9 (16.0) |
| Age groups, n (%) | |||
| 18-44 | 1,132,563 (17.7%) | 999,140 (18.2%) | 133,423 (15.2%) |
| 45-64 | 1,896,259 (29.7%) | 1,580,232 (28.7%) | 316,027 (36.0%) |
| 65-74 | 1,926,945 (30.2%) | 1,671,065 (30.4%) | 255,880 (29.1%) |
| ≥75 | 1,425,266 (22.3%) | 1,251,837 (22.8%) | 173,429 (19.7%) |
| Marital status, n (%) | |||
| Divorced/separated | 1,591,551 (24.9%) | 1,299,650 (23.6%) | 291,901 (33.2%) |
| Married | 3,505,231 (54.9%) | 3,127,213 (56.8%) | 378,018 (43.0%) |
| Never married/single | 842,385 (13.2%) | 698,995 (12.7%) | 143,390 (16.3%) |
| Widowed | 399,365 (6.3%) | 337,897 (6.1%) | 61,468 (7.0%) |
| Unknown/missing | 42,501 (0.7%) | 38,519 (0.7%) | 3,982 (0.5%) |
| Race/ethnicity, n (%) | |||
| AI/AN | 42,364 (0.7%) | 34,092 (0.6%) | 8,272 (0.9%) |
| API | 106,916 (1.7%) | 98,573 (1.8%) | 8,343 (0.9%) |
| Black | 1,050,033 (16.5%) | 786,697 (14.3%) | 263,336 (30.0%) |
| White | 4,545,996 (71.2%) | 4,059,114(73.8%) | 486,882 (55.4%) |
| Multiple races | 46,798 (0.7%) | 39,866 (0.7%) | 6,932 (0.8%) |
| Unknown/missing | 198,939 (3.1%) | 174,148 (3.2%) | 24,791 (2.8%) |
| Hispanic | 389,987 (6.1%) | 309,784 (5.6%) | 80,203 (9.1%) |
| Gender, n (%) | |||
| Female | 490,420 (7.7%) | 424,327 (7.7%) | 66,093 (7.5%) |
| Rurality, n (%) | |||
| Urban core | 4,178,508 (65.5%) | 3,606,128 (65.5%) | 572,380 (65.1%) |
| Suburban | 820,155 (12.9%) | 758,761 (13.8%) | 61,394 (7.0%) |
| Large rural | 739,265 (11.6%) | 609,226 (11.1%) | 130,039 (14.8%) |
| Small town/rural | 643,105 (10.1%) | 528,159 (9.6%) | 114,946 (13.1%) |
| Copay, n (%) | |||
| Copay required due to means | 1,518,264 (23.8%) | 1,357,131 (24.7%) | 161,133 (18.3%) |
| No copay required due to disability | 1,241,961 (19.5%) | 1,085,698 (19.7%) | 156,263 (17.8%) |
| No copay required due to means/other | 2,163,677 (33.9%) | 1,771,108 (32.2%) | 392,569 (44.7%) |
| Unassigned | 1,457,131 (22.8%) | 1,288,337 (23.4%) | 168,794(19.2%) |
| Hardship, n (%) | 468,251 (7.3%) | 357,987 (6.5%) | 110,264(12.5%) |
| Year of last AUDIT-C screen, n (%)a | |||
| 2013 | 340,531 (5.3%) | 291,026 (5.3%) | 49,505 (5.6%) |
| 2014 | 435,762 (6.8%) | 372,462 (6.8%) | 63,300 (7.2%) |
| 2015 | 651,379 (10.2%) | 557,392 (10.1%) | 93,987 (10.7%) |
| 2016 | 2,544,572 (39.9%) | 2,193,287 (39.9%) | 351,285 (40.0%) |
| 2017 | 2,408,789 (37.7%) | 2,088,107 (37.9%) | 320,682 (36.5%) |
Notes: VA = Veterans Health Administration; AI/AN = American Indian/Alaska Native; API = Asian/Pacific Islander.
Patients include those with an Alcohol Use Disorders Identification Test–Consumption (AUDIT-C) screen between 2013 and 2017; data from last screen for each patient were selected.

