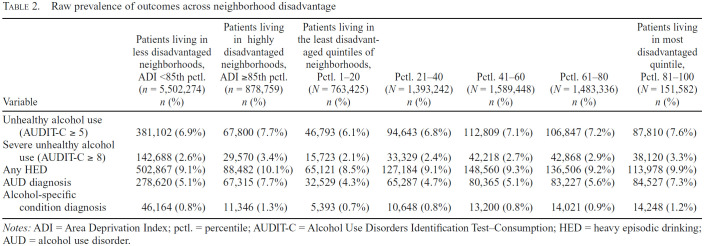
Table 2.
Raw prevalence of outcomes across neighborhood disadvantage
| Variable | Patients living in less disadvantaged neighborhoods, ADI <85th pctl. (n = 5,502,274) n (%) | Patients living in highly disadvantaged neighborhoods, ADIs ≥85th pctl. (n = 878,759) n (%) | Patients living in the least disadvantaged quintiles of neighborhoods, Pctl. 1-20 (N =763,425) n (%) | Pctl. 21-40 (N = 1,393,242) n (%) | Pctl. 41-60 (N = 1,589,448) n (%) | Pctl. 61-80 (N = 1,483,336) n (%) | Patients living in most disadvantaged quintile, Pctl. 81-100 (N = 151,582) n (%) |
|---|---|---|---|---|---|---|---|
| Unhealthy alcohol use (AUDIT-C ≥ 5) | 381,102 (6.9%) | 67,800 (7.7%) | 46,793 (6.1%) | 94,643 (6.8%) | 112,809 (7.1%) | 106,847 (7.2%) | 87,810(7.6%) |
| Severe unhealthy alcohol use (AUDIT-C ≥ 8) | 142,688 (2.6%) | 29,570 (3.4%) | 15,723 (2.1%) | 33,329 (2.4%) | 42,218 (2.7%) | 42,868 (2.9%) | 38,120 (3.3%) |
| Any HED | 502,867 (9.1%) | 88,482 (10.1%) | 65,121 (8.5%) | 127,184 (9.1%) | 148,560 (9.3%) | 136,506 (9.2%) | 113,978(9.9%) |
| AUD diagnosis | 278,620 (5.1%) | 67,315 (7.7%) | 32,529 (4.3%) | 65,287 (4.7%) | 80,365 (5.1%) | 83,227 (5.6%) | 84,527 (7.3%) |
| Alcohol-specific condition diagnosis | 46,164 (0.8%) | 11,346 (1.3%) | 5,393 (0.7%) | 10,648 (0.8%) | 13,200 (0.8%) | 14,021 (0.9%) | 14,248(1.2%) |
Notes: ADI = Area Deprivation Index; pctl. = percentile; AUDIT-C = Alcohol Use Disorders Identification Test–Consumption; HED = heavy episodic drinking; AUD = alcohol use disorder.

