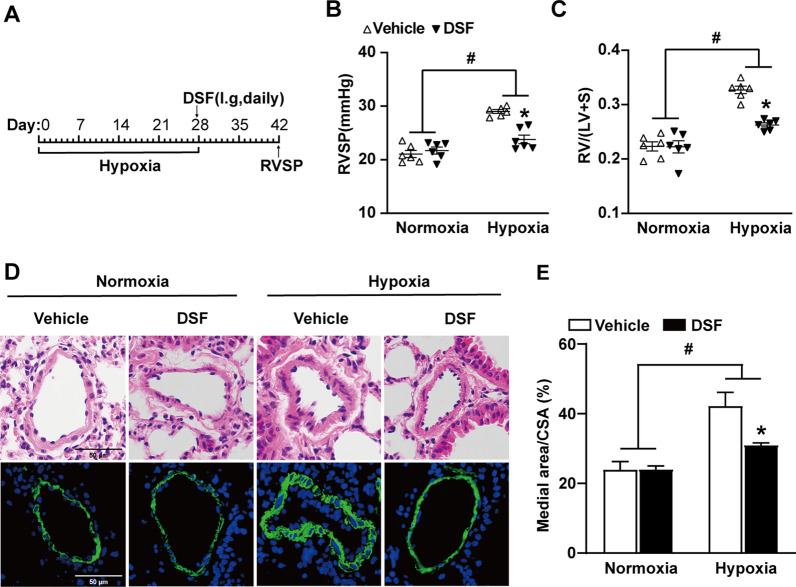
Fig. 2.
DSF attenuates the development of hypoxia-induced PH in mice. A Experimental design timeline of DSF therapy in hypoxia-induced PH in mice. B, C RVSP and RV/(LV + S) of mice that were treated with DSF after 4 weeks hypoxia (n = 6 each). D HE-stained images and immunofluorescence images of α-smooth muscle actin (green) expression in the pulmonary arteries from mice subjected to hypoxia and therapy with DSF. Scale bar: 50 μm, (n = 6 each). E Statistical annalysis of the ratio of medial area/CSA (pulmonary arteries with diameter 50–100 μm) for mice exposed to hypoxia and given DSF (n = 6 each). Values are the mean ± SEM. Statistical significance was analysed by one-way ANOVA test followed by Bonferroni’s multiple comparison test or the Kruskal–Wallis test. *P < 0.05 vs. vehicle, and #P < 0.05 vs. normoxia (n = 5 each). i.g.: intragastric

