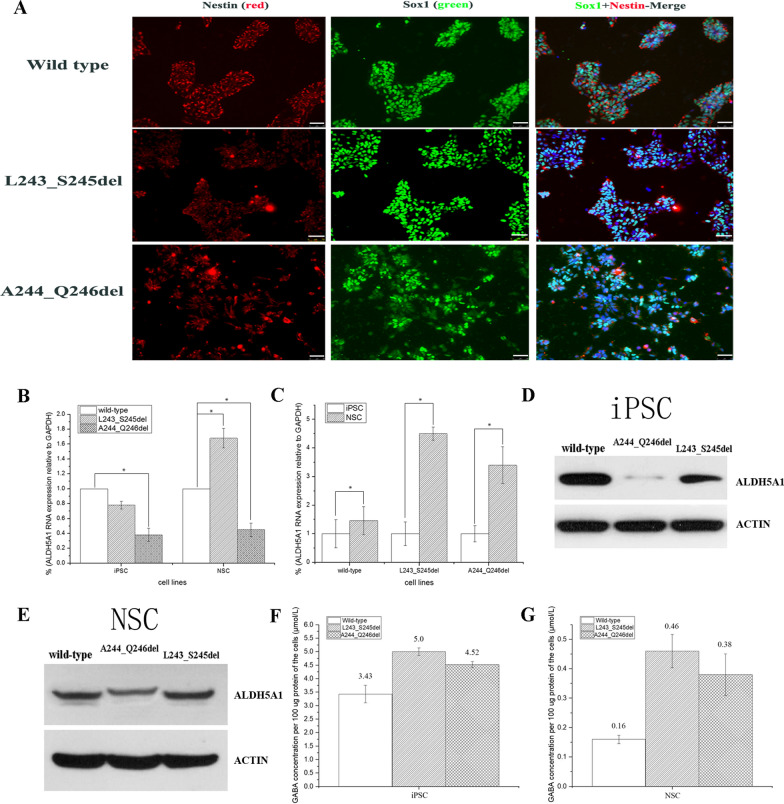
Fig. 2.
Characterization of ALDH5A1-mutated NSC lines (p.L243_S245del and p.A244_Q246del). A Immunofluorescence staining of iPSCs induced to neural stem cell lines (NSCs): Sox1 [scale bar = 50 μm, (white)], Nestin [scale bar = 50 μm, (white)]. B ALDH5A1 gene expression was measured by real-time quantitative PCR analysis and normalized to GAPDH. mRNA expression in iPSC lines and induced NSCs. The histogram shows the average value calculated by three pairs of qPCR primers mentioned in Table 1. The p.A244_Q246del mutant cells exhibited significantly reduced gene expression of ALDH5A1 compared with wild-type cells (*P < 0.01). However, the gene expression of ALDH5A1 of p.L243_S245del mutant showed a slight decrease, and it increased significantly and was higher than that of wild-type when induced to NSCs (*P < 0.01). (Each experiment was repeated three times, data are presented as mean) C The expression of the ALDH5A1 gene was increased significantly when human pluripotent stem cells were induced into neural stem cells (*P < 0.01). D–E Western blot analyses revealed that ALDH5A1 in the two iPSC mutant cell lines decreased. Each experiment was repeated three times. Ratio of the gray value of the target protein to the internal reference (from left to right) is 0.97, 0.06, 0.47 (iPSC); 0.43, 0.29, 0.46 (NSC). (see Additional files 1, 2) F Analysis of GABA accumulation in iPSC cell lines by denaturing high-performance liquid chromatography-tandem mass spectrometry. G Analysis of GABA accumulation in NSC cell lines by denaturing high-performance liquid chromatography-tandem mass spectrometry. In 2B, 2C, 2F, and 2G, data are shown as mean ± standard deviation

