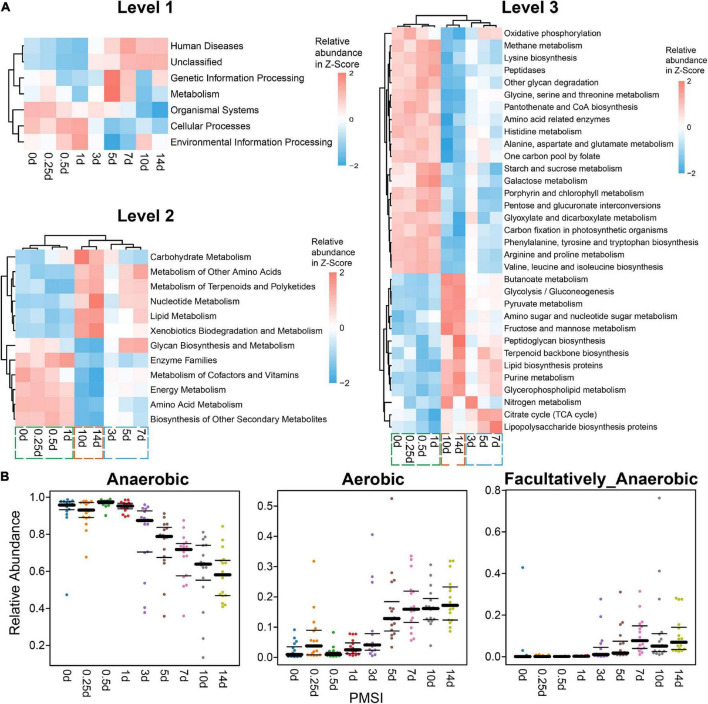
FIGURE 4.
Functional prediction analysis and phenotypic prediction based on bacterial sequences. (A) The heatmaps of the normalized relative abundance of the imputed functional profiles using PICRUSt grouped into levels 1–3 functional categories. At level 2, only significantly changed functions (p.adjust < 0.05) were shown. At level 3, only significantly changed functions (p.adjust < 0.05) with the relative abundance higher than 1% were shown. (B) Discrepancy in the gut microbial community phenotypes associated with aerobic, anaerobic, and facultatively anaerobic bacteria among PMSIs during decomposition.

