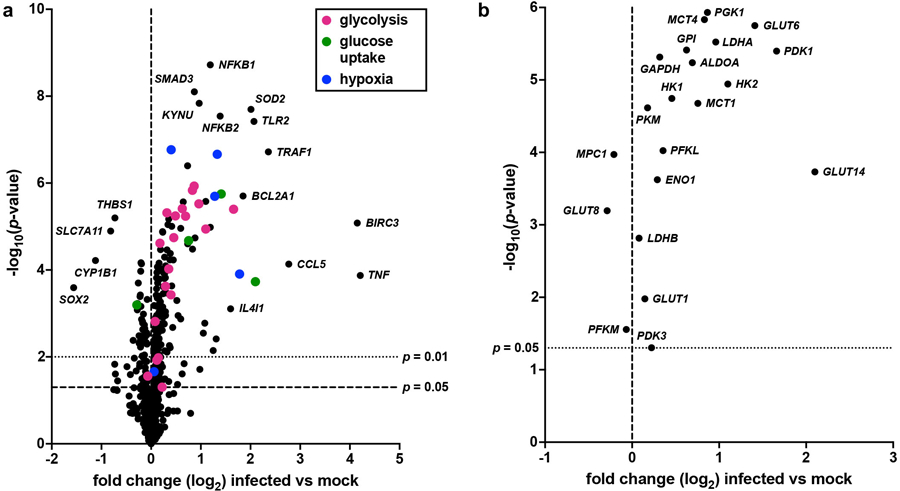
Extended Data Fig. 7. Intracellular infection modulates urothelial cell transcriptional programs.

a, Volcano plot depicting changes in transcript abundance between wild-type and mock infected urothelial cells. Transcripts involved in glycolysis, glucose uptake, and hypoxia are denoted by color. b, Volcano plot depicting changes in the abundance of metabolic transcripts depicted in Figure 5e between wild-type and mock infected urothelial cells. Data is representative of at least three biological replicates per group. Transcript normalization, differential expression calculations, and statistical comparisons were performed on the nSolver Advanced Analysis platform using the Benjamini-Yekutieli method.
