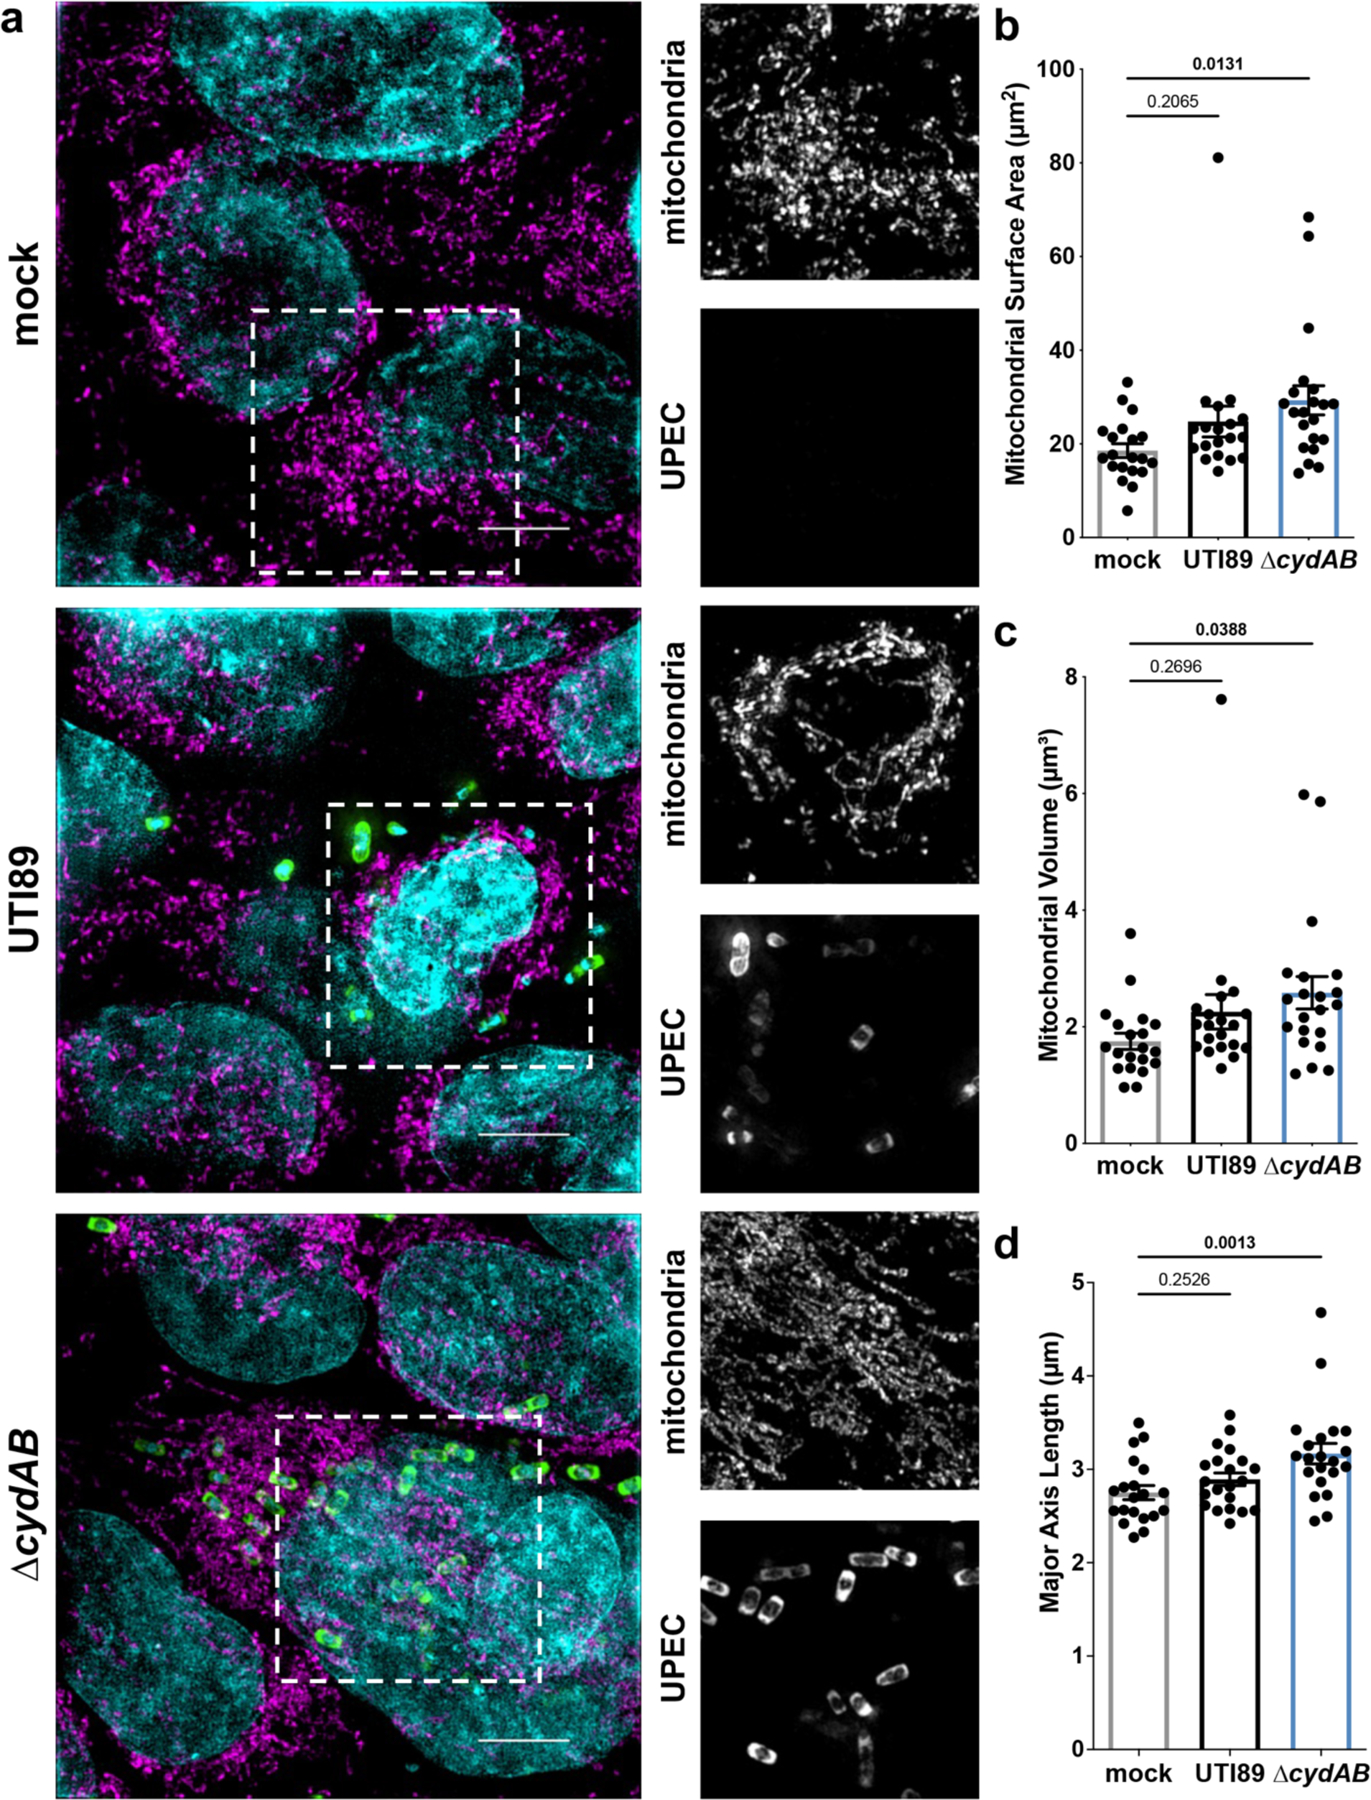
Figure 4: Intracellular bacterial infection enhances mitochondrial network fusion.

a, Representative structured illumination microscopy images of intracellularly infected or mock infected urothelial cells. Scale bar, 5 μm. Dashed box indicates area of interest shown in single color panels at right; cyan, DAPI; magenta, mitochondria; green, bacteria. (b-d) Quantification of mitochondrial surface area (b), volume (c), and major axis length (d) of intracellularly infected urothelial cells; mean ± SEM; one-way ANOVA with Dunnett’s test for multiple comparisons. Each point represents the average value for an individual cell. Experiments were performed on at least three biological replicates. Exact p-values are provided in the figure, with bold values indicating statistical significance (p < 0.05).
