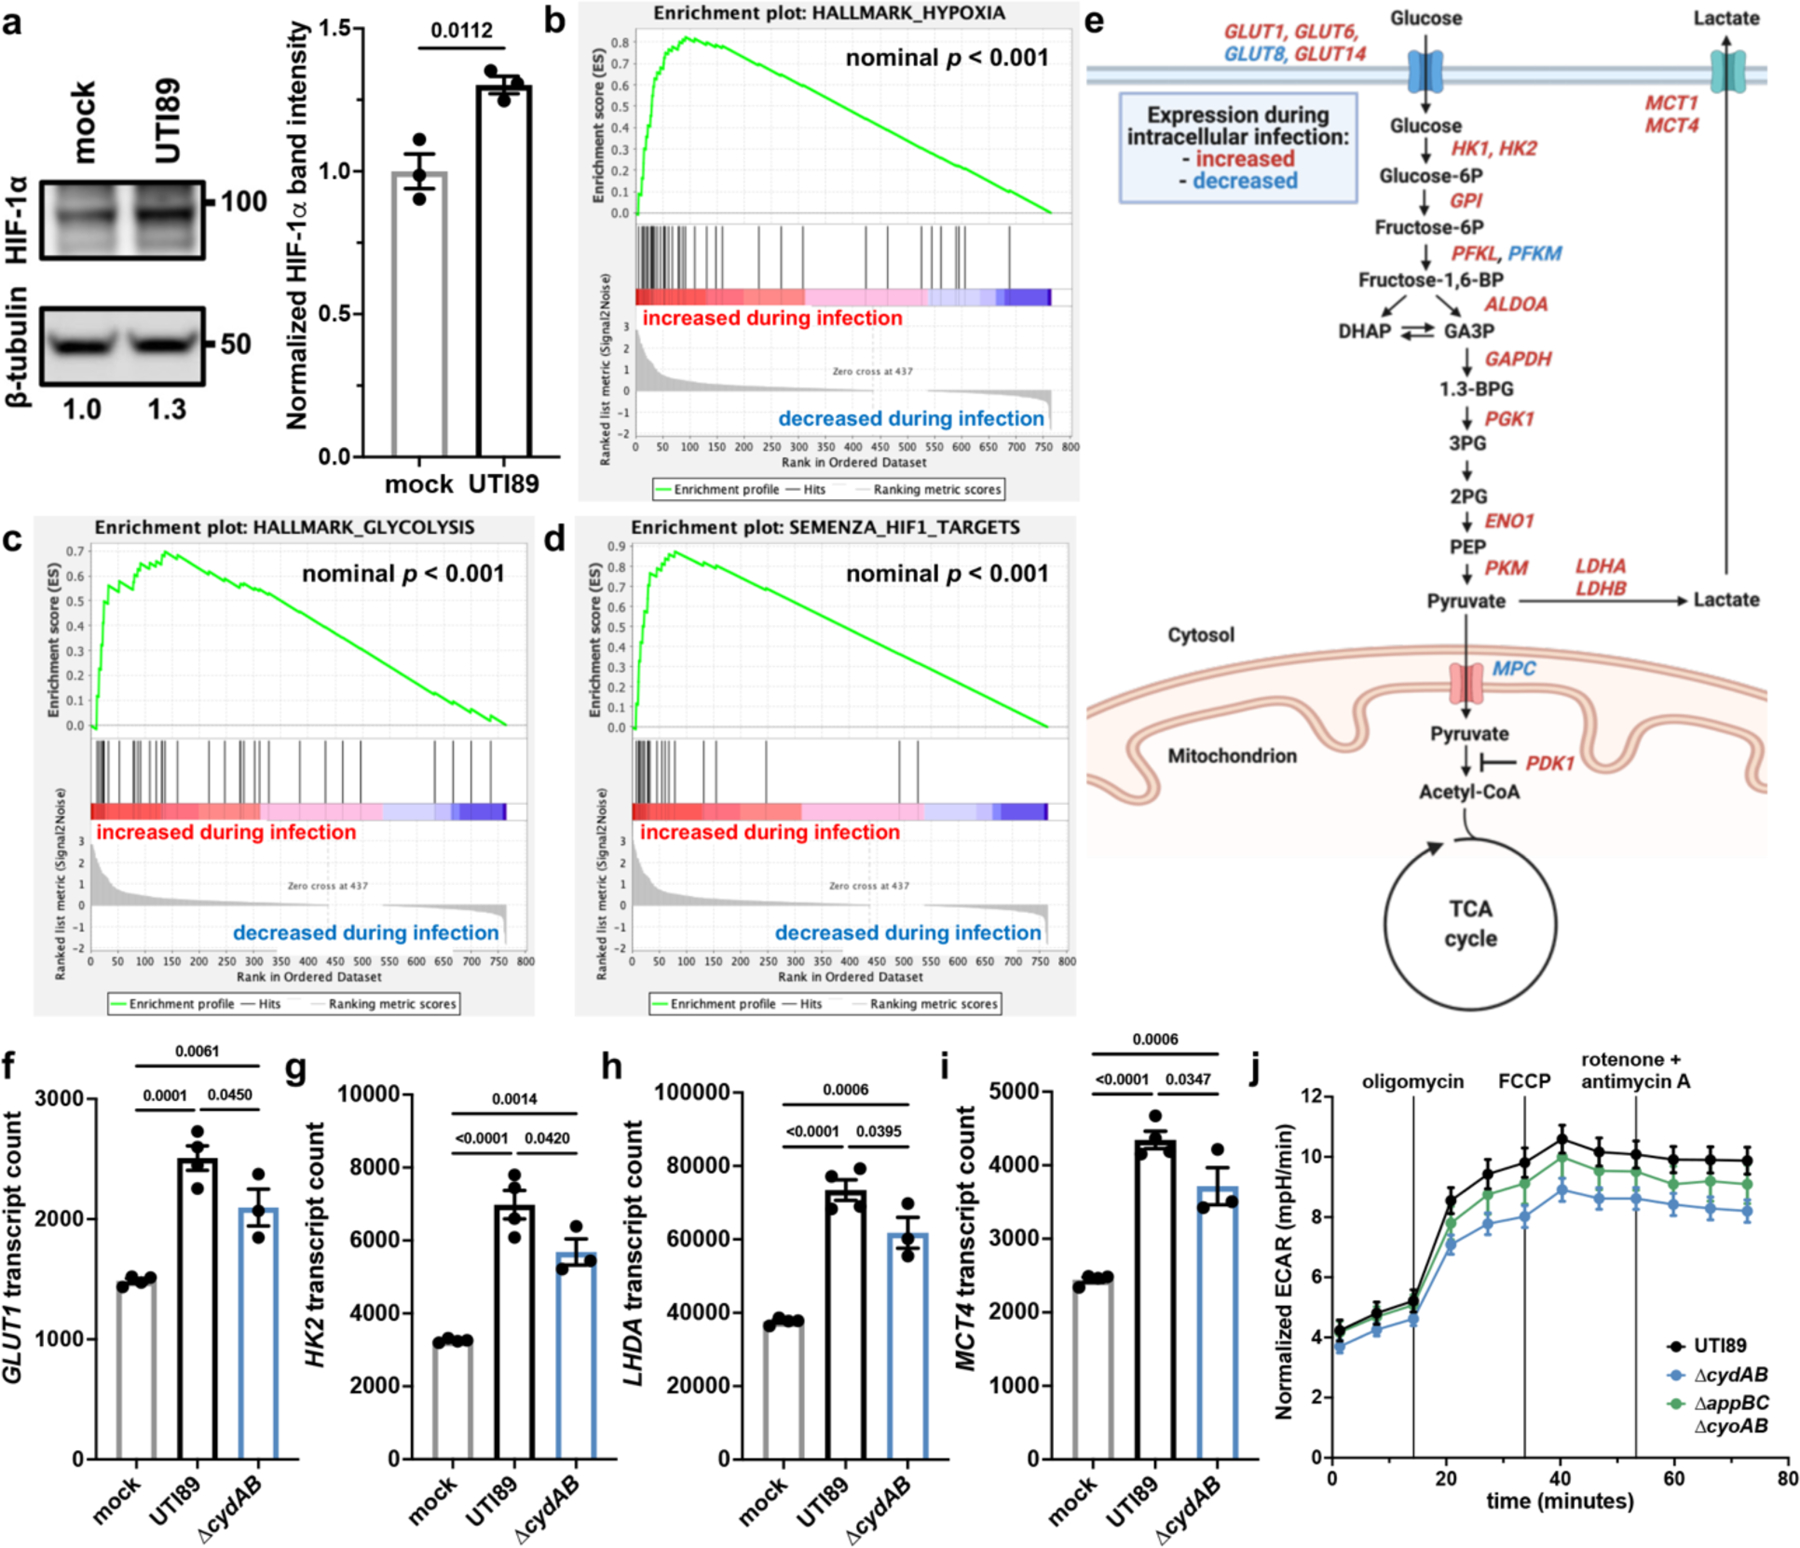
Figure 5: Intracellular infection of urothelial cells induces a shift toward aerobic glycolysis.

a, left, HIF-1α immunoblot performed on intracellularly infected or mock infected urothelial cells. right, Quantification of HIF-1α band intensity normalized to β-tubulin; mean ± SEM; two-tailed unpaired t test. b-d, Gene set enrichment analyses of hypoxia hallmark genes (b), glycolysis hallmark genes (c), and HIF-1 target genes (d). Green line depicts running enrichment score, black lines indicate the location of each gene within the ranked list of differentially regulated transcripts; empirical phenotype-based permutation test. e, Schematic depicting metabolic genes with significant differences in transcript abundance between intracellularly infected and mock infected cells. f-i Normalized counts of select HIF-1 regulated metabolic transcripts shown in (e); mean ± SEM; one-way ANOVA with Tukey’s test for multiple comparisons. j, Extracellular acidification rate (ECAR) of intracellularly infected urothelial cells; mean ± SEM. Each point represents a biological replicate. Experiments were performed on at least three biological replicates. Exact p-values are provided in the figure, with bold values indicating statistical significance (p < 0.05).
