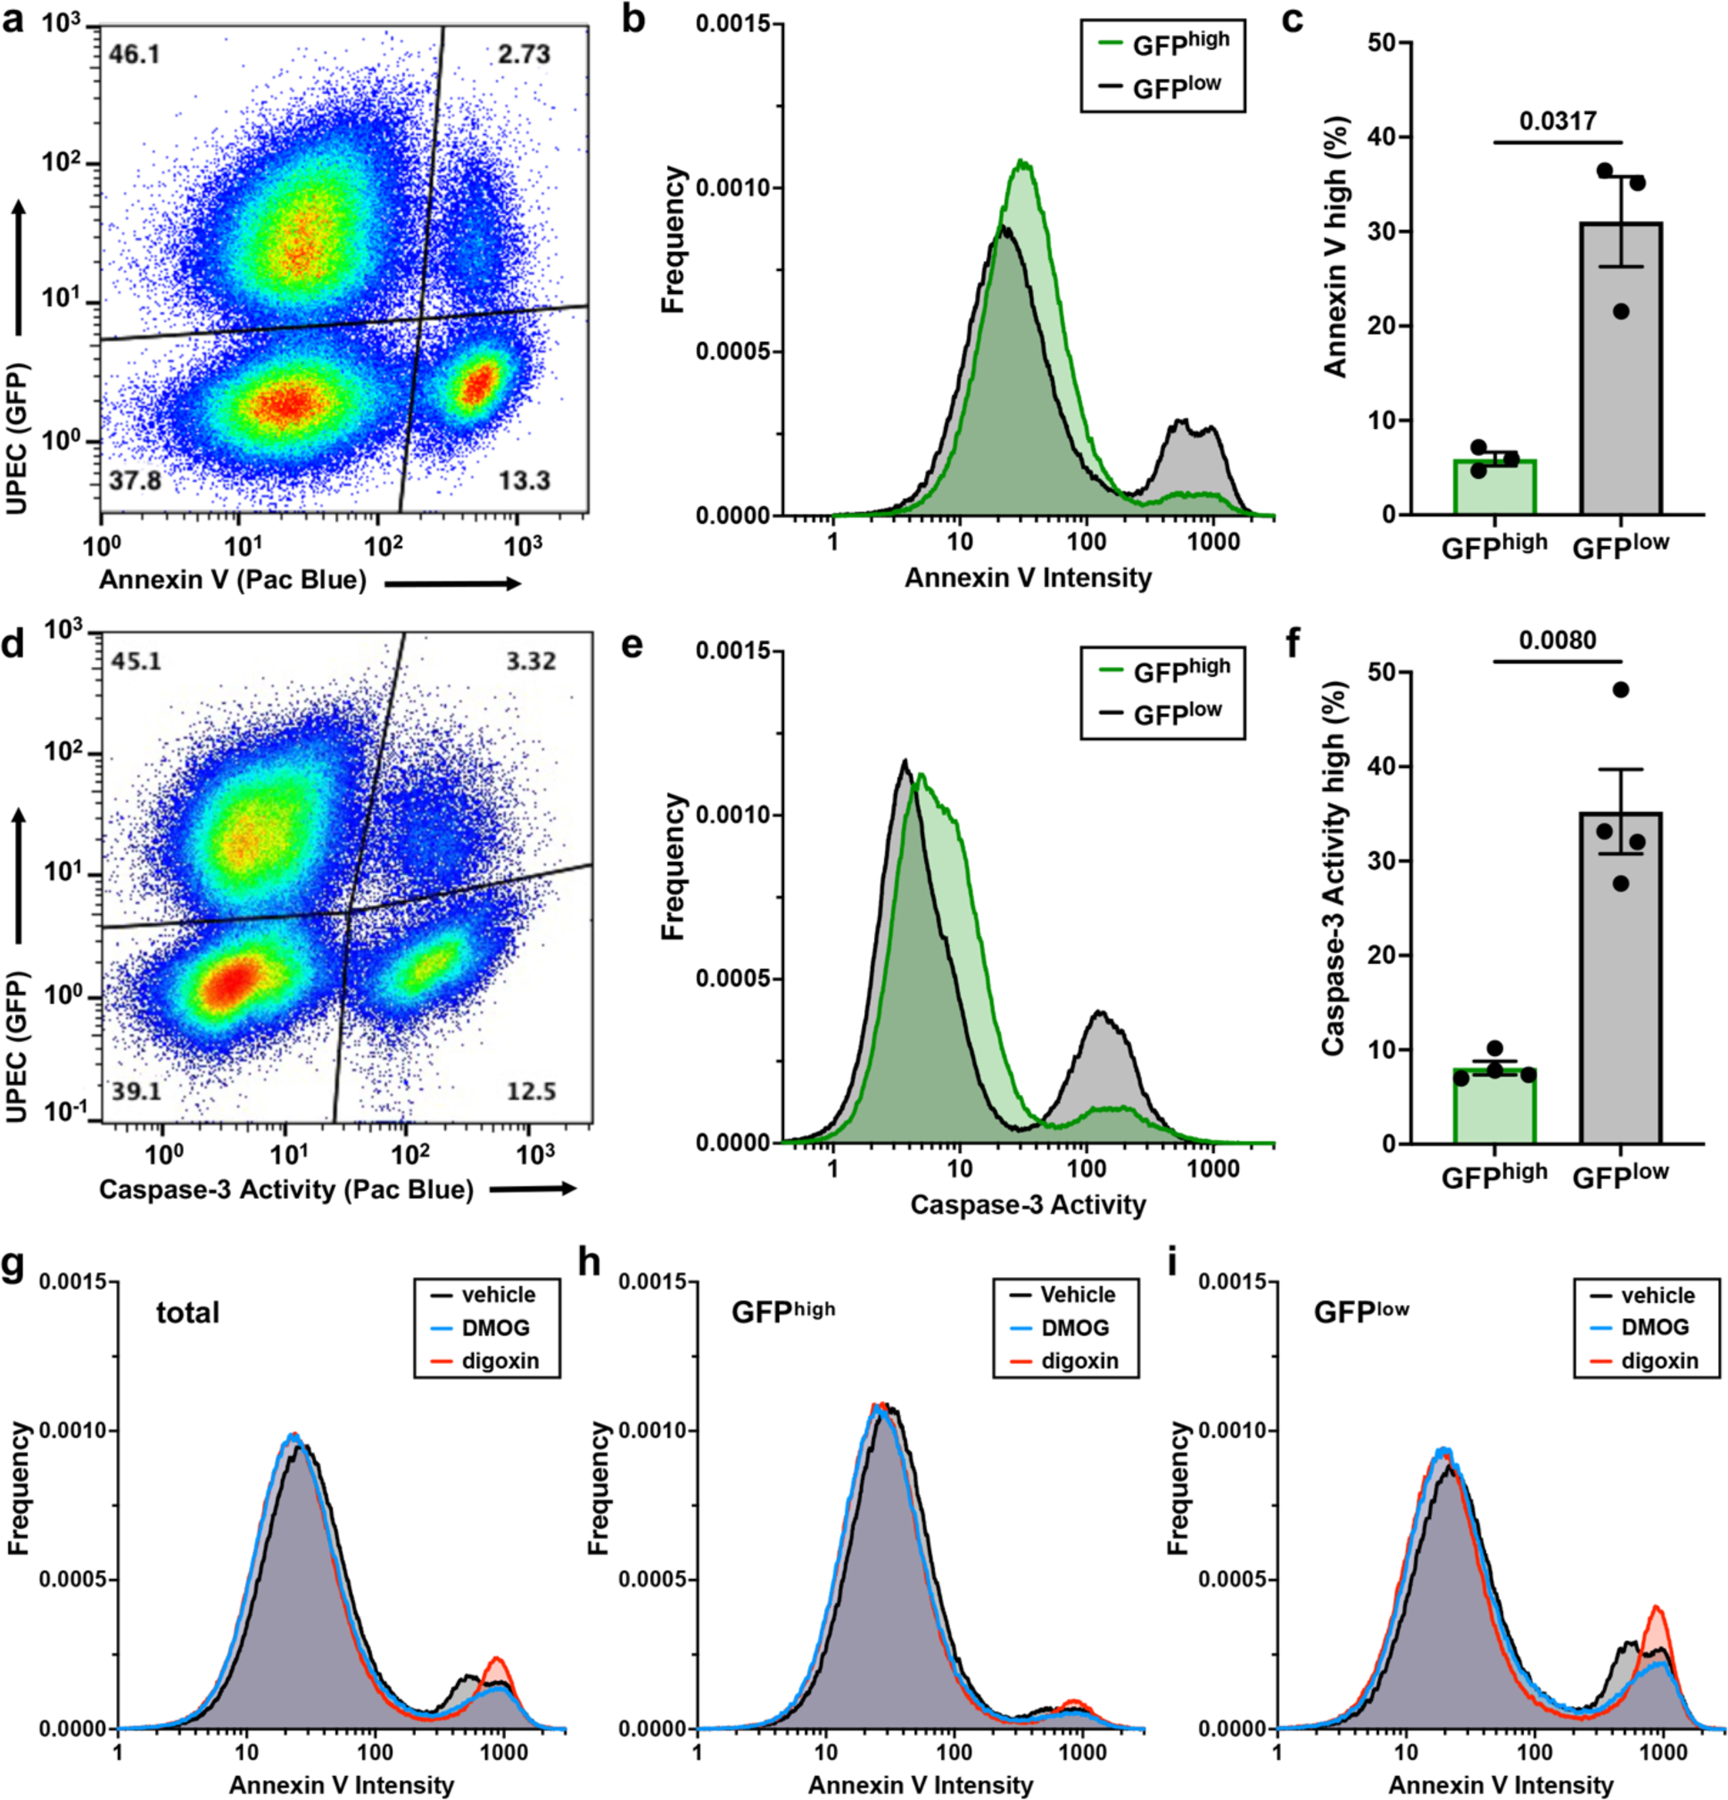
Figure 6: Rewiring of host metabolism modulates urothelial cell survival during intracellular infection.

a, Representative flow cytometry plot depicting annexin V staining in intracellularly infected (GFPhigh) and uninfected (GFPlow) urothelial cells. b, Histogram depicting annexin V staining intensity. c, Plot depicting the proportion of urothelial cells with high annexin V staining; mean ± SEM; two-tailed Welch’s t test. d, Representative flow cytometry plot depicting caspase-3 activity in intracellularly infected (GFPhigh) and uninfected (GFPlow) urothelial cells. e, Histogram depicting caspase-3 activity. f, Plot depicting the proportion of urothelial cells with high caspase-3 activity; mean ± SEM; two-tailed Welch’s t test. g-i, Histograms depicting annexin V staining intensity in all urothelial cells (g), intracellularly infected (GFPhigh) urothelial cells (h), and uninfected (GFPlow) urothelial cells (i) treated with digoxin, DMOG, or vehicle at the time of infection. In (a) and (d) each dot represents one cell, and relative population density is represented by a color spectrum (red indicates regions of high cell density, blue indicates regions of low cell density). All experiments were performed with a minimum of three biological replicates. Exact p-values are provided in the figure, with bold values indicating statistical significance (p < 0.05).
