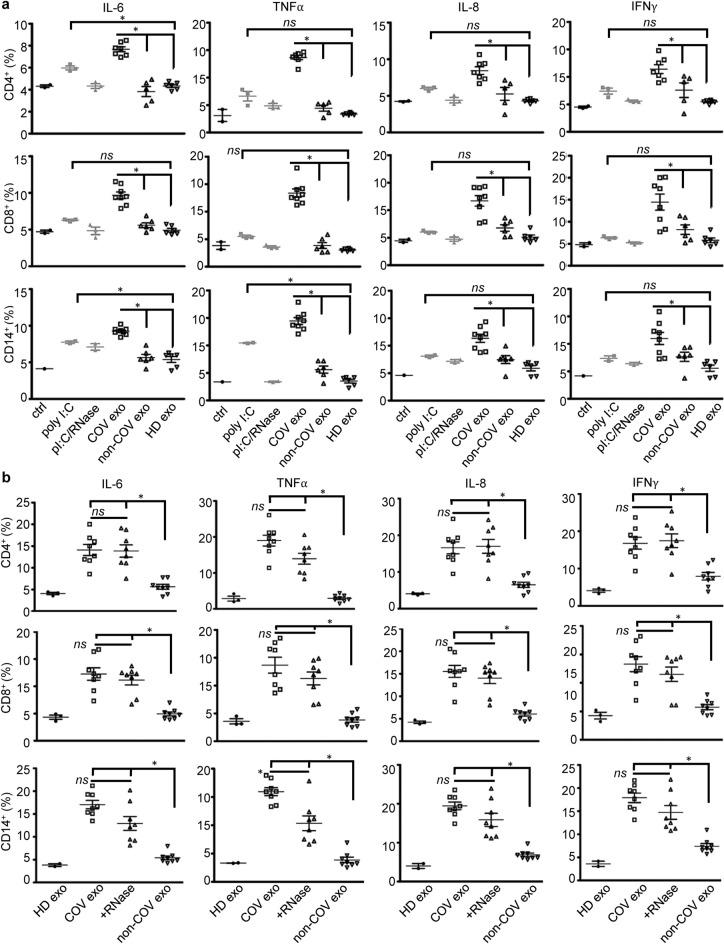
Figure 5.
Production of cytokines in response to plasma exosomes and RNase. (a) CD4+ T cells, CD8+ T cells, and CD14+ monocytes were separated from PBMCs using MicroBeads, followed by treatment with plasma exosomes (4 × 10⁹ ml−1) from COVID-19 patients upon admission (COV exo, n = 8), non-COVID donors (non-COV exo, n = 6), healthy donors (HD exo, n = 5) as well as poly(I:C) (poly I:C, 5 µg ml−1) and poly(I:C) treated with RNase A (pI:C/RNase) in RPMI medium for 16 h at 37 °C. ctrl, medium only. Expression of cytokines was determined by flow cytometry gating on live cells. Data represent one experiment out of three repeats. Each flow cytometry assay was run in triplicate. Error bars, ± SD; *p < 0.05; ns, p > 0.05. One-way ANOVA. (b) COVID-19 plasma exosomes treated with an RNase (+ RNase, 50 µg ml−1 at 37 °C for 10 min) or remained untreated (COV exo) were used to stimulate PBMC for cytokine flow cytometry as in (a). Plasma exosomes from non-COVID (non-COV exo) and healthy donors (HD exo) were used as controls. Error bars, ± SD; *p < 0.05; ns, p > 0.05; one-way ANOVA. Graphs shown representative results from three biological repeats. Isotype antibody controls and blank controls were performed in parallel in flow cytometry.

