Figure 1.
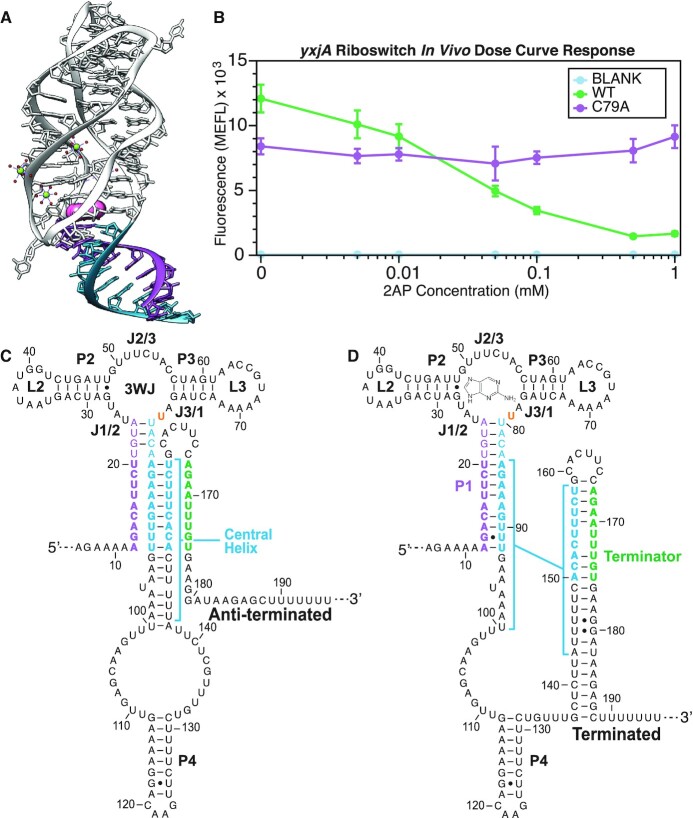
Structures and ligand-dependent functional response of the yxjA riboswitch. (A) Color coded crystal structure (PDB ID: 1Y27) of the purine riboswitch aptamer in the ligand-bound holo conformation. The ligand is colored pink, the 5′ side of the P1 helix purple, and the 3′ side of the P1 helix teal (58). (B) Dose–response curve of the yxjA riboswitch regulation in Escherichia coli cells. E. coli cells were transformed with plasmids containing riboswitch expression constructs and characterized for SFGFP fluorescence using flow cytometry after 5 h of growth in M9 minimal media subcultures with or without 2-aminopurine (2AP) added. Dots represent averages from three biological replicates, each performed in triplicate technical replicates for a total of nine data points (n = 9), with error bars representing standard deviation. A blank control with a constitutive promoter and no SFGFP was used to measure any cellular background fluorescence levels in response to ligand in the media. A non-ligand-responsive riboswitch construct (C79A) was used as a negative control to account for non-riboswitch regulated changes in fluorescence in response to ligand in the media. WT represents the wild-type yxjA riboswitch sequence in the expression construct, mutated (C79U) to recognize adenine and 2AP (see Materials and Methods). Riboswitch secondary structure models in (C) represent the predicted anti-terminated conformation consisting of an intact aptamer domain with C79U mutation, a partially disrupted P1 stem, and the central helix formed. Secondary structure models in (D) represent the predicted terminated conformation consisting of the intact aptamer domain with C79U mutation, a fully formed P1 helix and the formed intrinsic terminator expression platform. Secondary structure models are based on minimum free energy predictions from Mulhbacher and Lafontaine, 2007 (44). Nucleotide regions are colored to represent base pairs that are mutually exclusive between the anti-terminated and terminated structure models (teal), nucleotides that are predicted to complete the P1 helix on the 5′ side (purple), and nucleotides predicted to complete the terminator on the 3′ side (green). In (D), the ligand is shown in proximity to the 3WJ ligand-binding pocket, where the residue U79 that makes ligand contacts is highlighted in orange.

