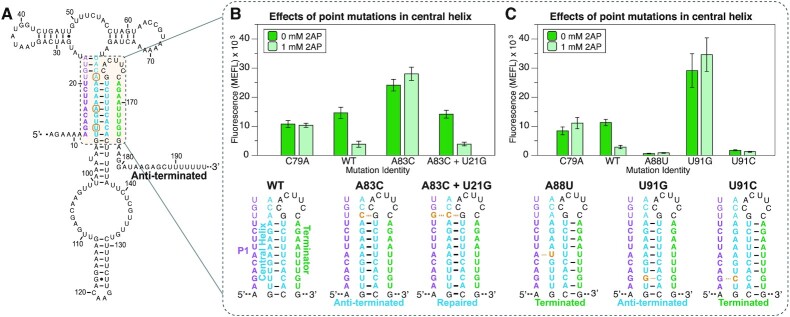
Figure 4.
Flow cytometry gene expression characterization data of yxjA riboswitches containing point mutations and rescue mutations in the central helix. (A) Schematic of mutation locations (orange circles) based on where natural single mismatches were found. (B) Single mismatch mutants at position 83 (A83C) and repair at position 21 (A83C + U21G), and (C) single mismatch mutants at positions 88 (A88U) and 91 (U91G and U91C). Schematic of mutations are shown below the bar graphs. Data were collected as described in Figure 1 using the indicated amount of ligand (2AP) in the media. Bars represent averages from three biological replicates, each performed in triplicate technical replicates for a total of nine data points (n = 9), with error bars representing standard deviation.

