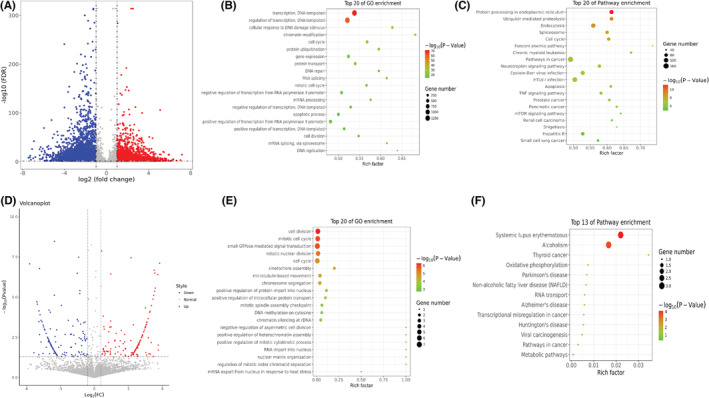
FIGURE 2.

Functional enrichment analysis of transcripts. (A) Volcano plots expressed the numbers of transcripts with significantly differential m6A peaks. (B) Bubble chart represents GO terms. (C) Bubble chart represents KEGG pathway. (D) Volcano plots showed the differential expressed transcripts. (E) Bubble chart represents GO terms. (F) Bubble chart represents KEGG pathway.
