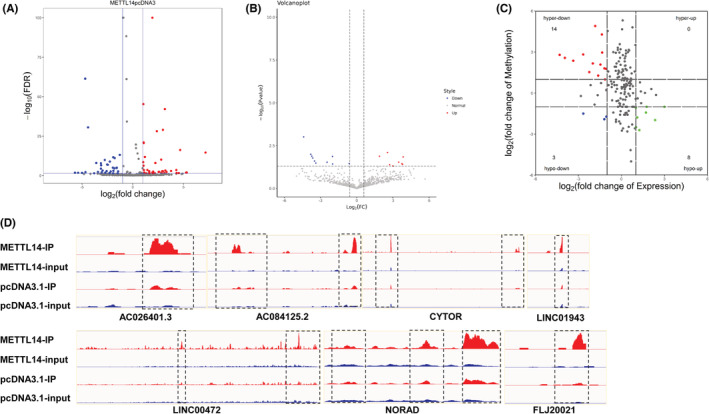
FIGURE 3.

Conjoint analysis of MeRIP‐seq and RNA‐seq data. (A) Volcano plots expressed the numbers of lncRNAs with significantly differential m6A peaks. (B) Volcano plots showed the differential expressed lncRNAs. (C) The four‐quadrant diagram showed the m6A methylation lncRNAs and differentially expressed lncRNAs. The red dots expressed downregulated lncRNAs with hypermethylation, the blue dots expressed downregulated lncRNAs with hypomethylation, and the green dots expressed upregulated lncRNAs with hypomethylation. (D) Peak of lncRNAs in the METTL14‐overexpression and control group
