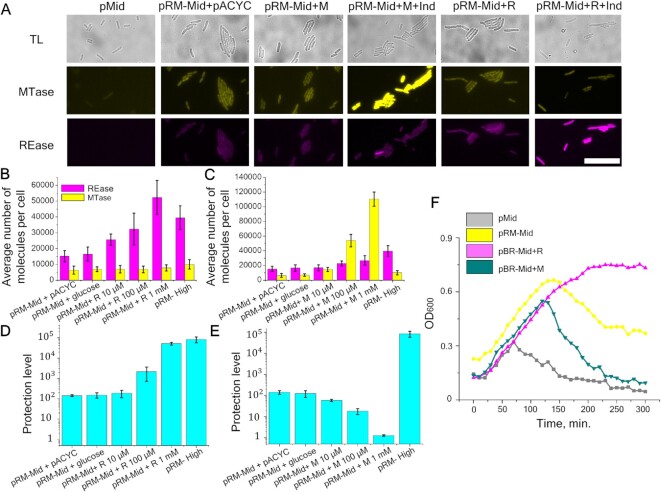
Figure 2.
The influence of additionally induced Esp1396I enzymes on the level of protection. (A) Images of cells in transmitted light (gray) and in two fluorescence channels Venus (yellow) and mCherry (magenta): pMid - control cells without the RM system; pRM-Mid+ pACYC – cells with pRM-Mid and pACYC plasmids; pRM-Mid+ M – cells with pRM-Mid and +M plasmids with or without 10 mM arabinose induction; pRM-Mid+ R – cells with pRM-Mid and +R plasmids with or without 10 mM arabinose induction). Scale bar is 20 μm. (B, C) Intensities of fluorescence in 300 individual cells with additional synthesis of REase (B) or MTase (C) induced by different concentrations of arabinose. Yellow and magenta bars represent the mean number of MTase and REase molecules per cell, respectively. Error bars represent standard error of the mean. (D, E) Protection from phage infection of cells with additionally expressed REase (D) or MTase (E). Protection levels were determined as described in Figure 1F legend. Error bars represent standard error of the mean. (F) Growth of cultures of cells without RM protection (pMid), cells carrying the pRM-Mid plasmid, and pRM-Mid carrying cells expressing additional MTase (pRM-Mid + M) or REase (pRM-Mid + R). Cells were grown in the presence of 1 mM arabinose. At zero time point, cultures were infected with λvir phage at a MOI of 0.2 (the arrow indicates start of infection).

