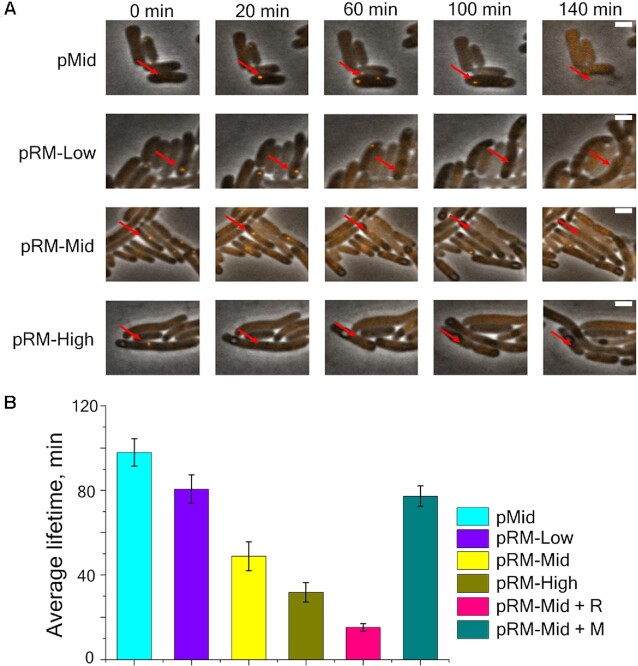
Figure 3.
Degradation of phage DNA in single cells protected by Esp1396I. (A) Images from a time-lapse movie showing the appearance of SeqA::mKO2 foci in cells from indicated cultures. Red arrow points to cells infected with phage. Scale bar is 2 μm. (B) Average foci lifetimes in infected cells carrying indicated plasmids. Mean values obtained upon observation of 690 infected cells carrying empty pMid plasmid, 43 cells carrying the pRM-High plasmid, 128 cells carrying the pRM-Mid plasmid, 133 cells carrying the pRM-Low plasmid, 214 induced cells carrying pRM-Mid and +M plasmids, and 49 induced cells carrying the pRM-Mid and +R plasmids are shown. Error bars represent standard errors of the mean.

