Figure 1.
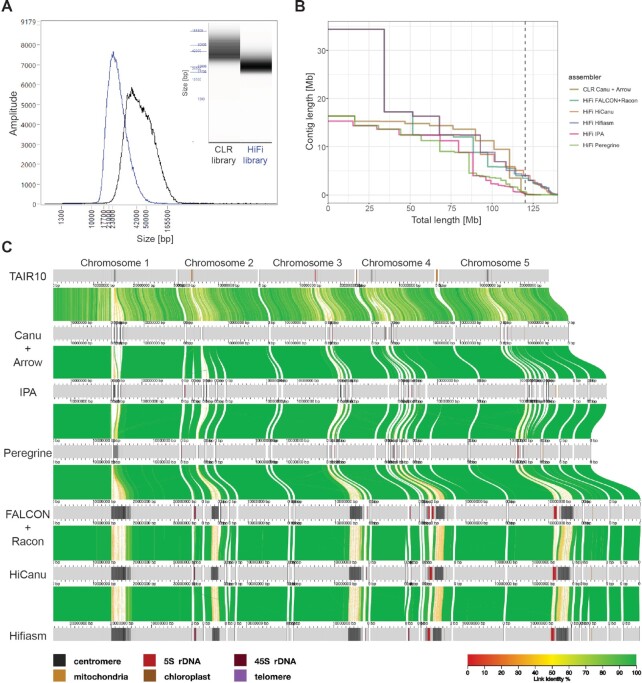
Comparison of different PacBio libraries and assemblers. (A) Insert size distribution of the CLR (black) and HiFi (blue) libraries after size-selection on the BluePippin instrument as measured on a Femto Pulse System. (B) Contiguity plot comparing the CLR and five HiFi assemblies using the complete dataset. For each assembly, the cumulative contig length (ordered from largest to shortest) is plotted over the estimated genome size of A. thaliana accession Ey15-2 (∼143 Mb). The vertical dashed line indicates the size of the TAIR10 reference genome (119.14 Mb). (C) Alignment of the TAIR10 reference genome and the contigs of the CLR and five HiFi assemblies visualized by AliTV (70). Co-linear horizontal gray bars represent chromosomes or contigs, with sequence annotated as repetitive elements (centromeres, 5S and 45S rDNAs, telomeres, mitochondrial and chloroplast nuclear insertions) indicated by the colors shown on the bottom left. Only Bionano-scaffolded contigs >150 kb are shown. Distance between ticks equals 1 Mb. Colored ribbons connect corresponding regions in the alignment.

