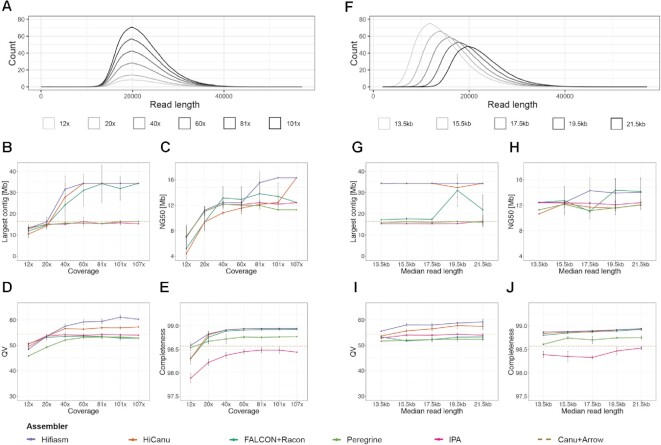
Figure 2.
Impact of coverage and read length on assembly metrics. (A) Read length distribution of subsets of HiFi reads with varying coverages, 12×, 20×, 40×, 60×, 81× and 101×. (B) Largest contig as a function of input coverage. (C) Contig NG50 as a function of input coverage. We define NG50 as the sequence length of the shortest contig for which longer and equal size contigs cover at least 50% of the size of the TAIR10 reference genome (119.14 Mb) (2). (D) Consensus quality (QV) estimated by Merqury (49) as a function of input coverage. (E) k-mer completeness estimated by Merqury (49) as a function of input coverage. QV and completeness were computed after reference-based scaffolding with RagTag (48). (F) Read length distribution of subsets of HiFi reads with varying median read lengths, 13.5, 15.5, 17.5, 19.5 and 21.5 kb. (G) Largest contig as a function of median read length. (H) Contig NG50 as a function of median read length. (I) QV as a function of median read length. (J) k-mer completeness as a function of median read length.

