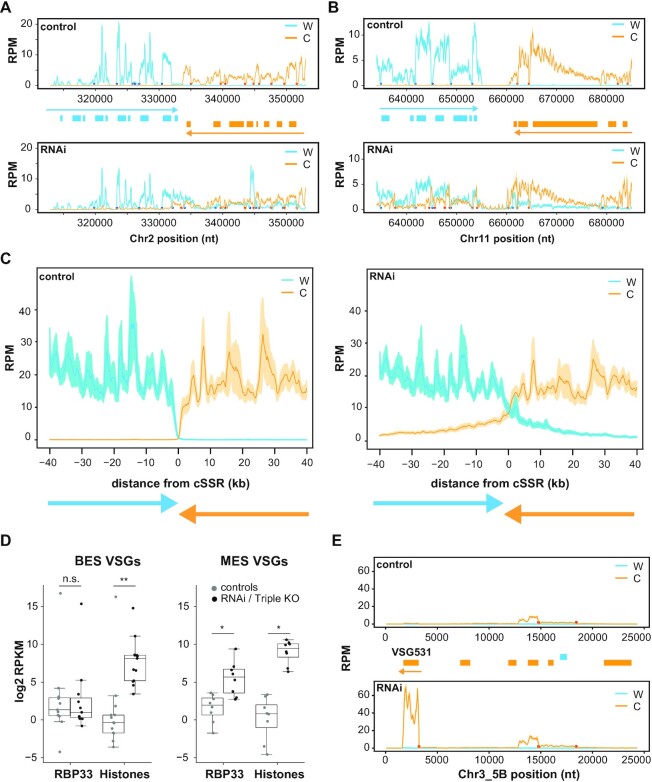
Figure 2.
Coverage plots of representative genomic regions, and effect of RBP33 depletion on VSG transcripts levels. Reads counts were obtained separately from Watson (W, blue lines) or Crick (C, orange lines) strands in bloodstream forms with sliding windows (100 bp bins, 10 bp step in A, B and E; 1000 bp bins and steps of 100 bp in C) and normalized by library size (RPM). Values from control were compared with those from RBP33-depleted samples (RNAi), and represented as the mean (solid lines) ± SEM (shaded area) of the coverage across 30 cSSRs (C) or the mean ± SEM of three RNA-seq biological replicates (A, B and E). Genes are represented as boxes (blue, protein-coding genes in the W strand; orange, protein-coding genes in the C strand), and colored arrows denote the direction of transcription in each PTU. Blue and orange circles indicate trans-splicing acceptor sites assigned to W and C strands, respectively. (A and B) Examples of convergent SSRs, cSSR2:2 and cSSR11:2 (see Supplementary Table S1 for SSR nomenclature details). (C) Mean coverage across 30 cSSRs. (D) Effect of RBP33 depletion and ΔH3vΔH4vΔJ triple KO on the expression of metacyclic (MES) and bloodstream (BES) VSG genes. Read counts were normalized to CPM in edgeR, converted to RPKM and transformed to log2. Average RPKM values across RNA-seq replicates were calculated for 17 BES VSG and 8 MES VSG transcripts and represented in box plots (boxes represent the IQR; whiskers, ±1.5 IQR; waists, medians; dots, individual VSG transcripts). Only VSG transcripts showing values of RPKM ≥1 in at least three replicates were considered. Two-sided Mann–Whitney U-tests were used to assess whether there was significant differential expression between RBP33-depleted or triple KO and their respective control samples; n.s., not significant (P >0.5); *P <0.005; **P <0.0005 (n = 11/13 BES VSGs; n = 8 MES VSGs). (E) Coverage plot corresponding to the metacyclic VSG531 locus.

