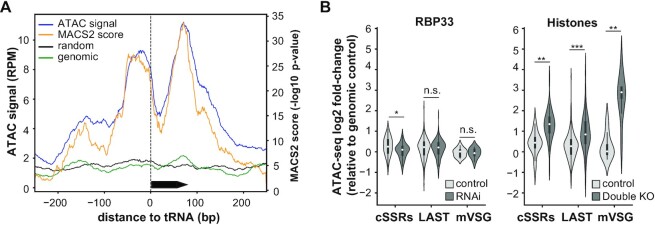
Figure 3.
ATAC-seq analysis. (A) Single base coverage plot for ATAC signal at non-clustered tRNA genes in control bloodstream trypanosomes. Black arrow box represents a tRNA gene. Read counts were obtained for genomic regions centered at non-clustered tRNA genes and extended 250 bp on each side, normalized by library size (RPM), and represented as the average of RPM values (blue line) or MACS2 scores (orange line) across 10 different tRNA loci. ATAC signals corresponding to the average of 10 randomly chosen regions of the same size (black line), and to a transposed genomic DNA control (green line) are also shown. (B) Violin plots showing chromatin accessibility in controls (light gray violins), RBP33-depleted and ΔH3vΔH4v double KO trypanosomes (dark gray violins). Average ATAC signal values across ATAC-seq replicates were obtained for cSSRs, ‘last’ and metacyclic VSG genes, and expressed as the log2 ratio relative to transposed genomic DNA control; only loci with CPM values ≥1 in at least two replicates were considered. Miniature box plots are shown inside each violin (boxes represent the IQR; whiskers, ±1.5 IQR; white circles, medians). Two-sided unpaired Student's t-tests were used to assess whether chromatin accessibility was significantly altered in RBP33-depleted or ΔH3vΔH4v double KO samples relative to their respective control samples. n.s., not significant (P >0.5); *P <5 × 10⁻³; **P <5 × 10⁻⁶; ***P <5 × 10–20 (n = 58, n = 279 and n = 8 for cSSRs, ‘last’ genes and metacyclic VSGs, respectively).

