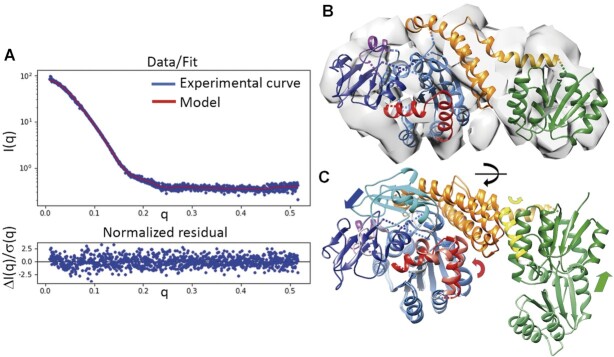
Figure 8.
Analysis of the PorX monomer in solution. (A) Experimental scattering-intensity curve (blue dots) represented on a logarithmic scale as a function of the momentum transfer. The curve of the fitted model (panel (B), in red) describes the complete q-range with a χ2 of 1.15. Below, the normalized residuals show the quality of fit along the q-range. (B) PorX monomer model fitted into the ab initio electron density map (loops excluded). (C) Superposition of the monomer in the crystallographic dimer onto the monomer in solution. The arrows show the main direction of the displacement for the RD (in green), helix 1 from the helical bundle domain (in yellow), the cap domain (in blue) and the dimer interface region (in red). Compared to (B), the superposition was slightly rotated (black arrow on the horizontal axis) for better visualization of the differences.

