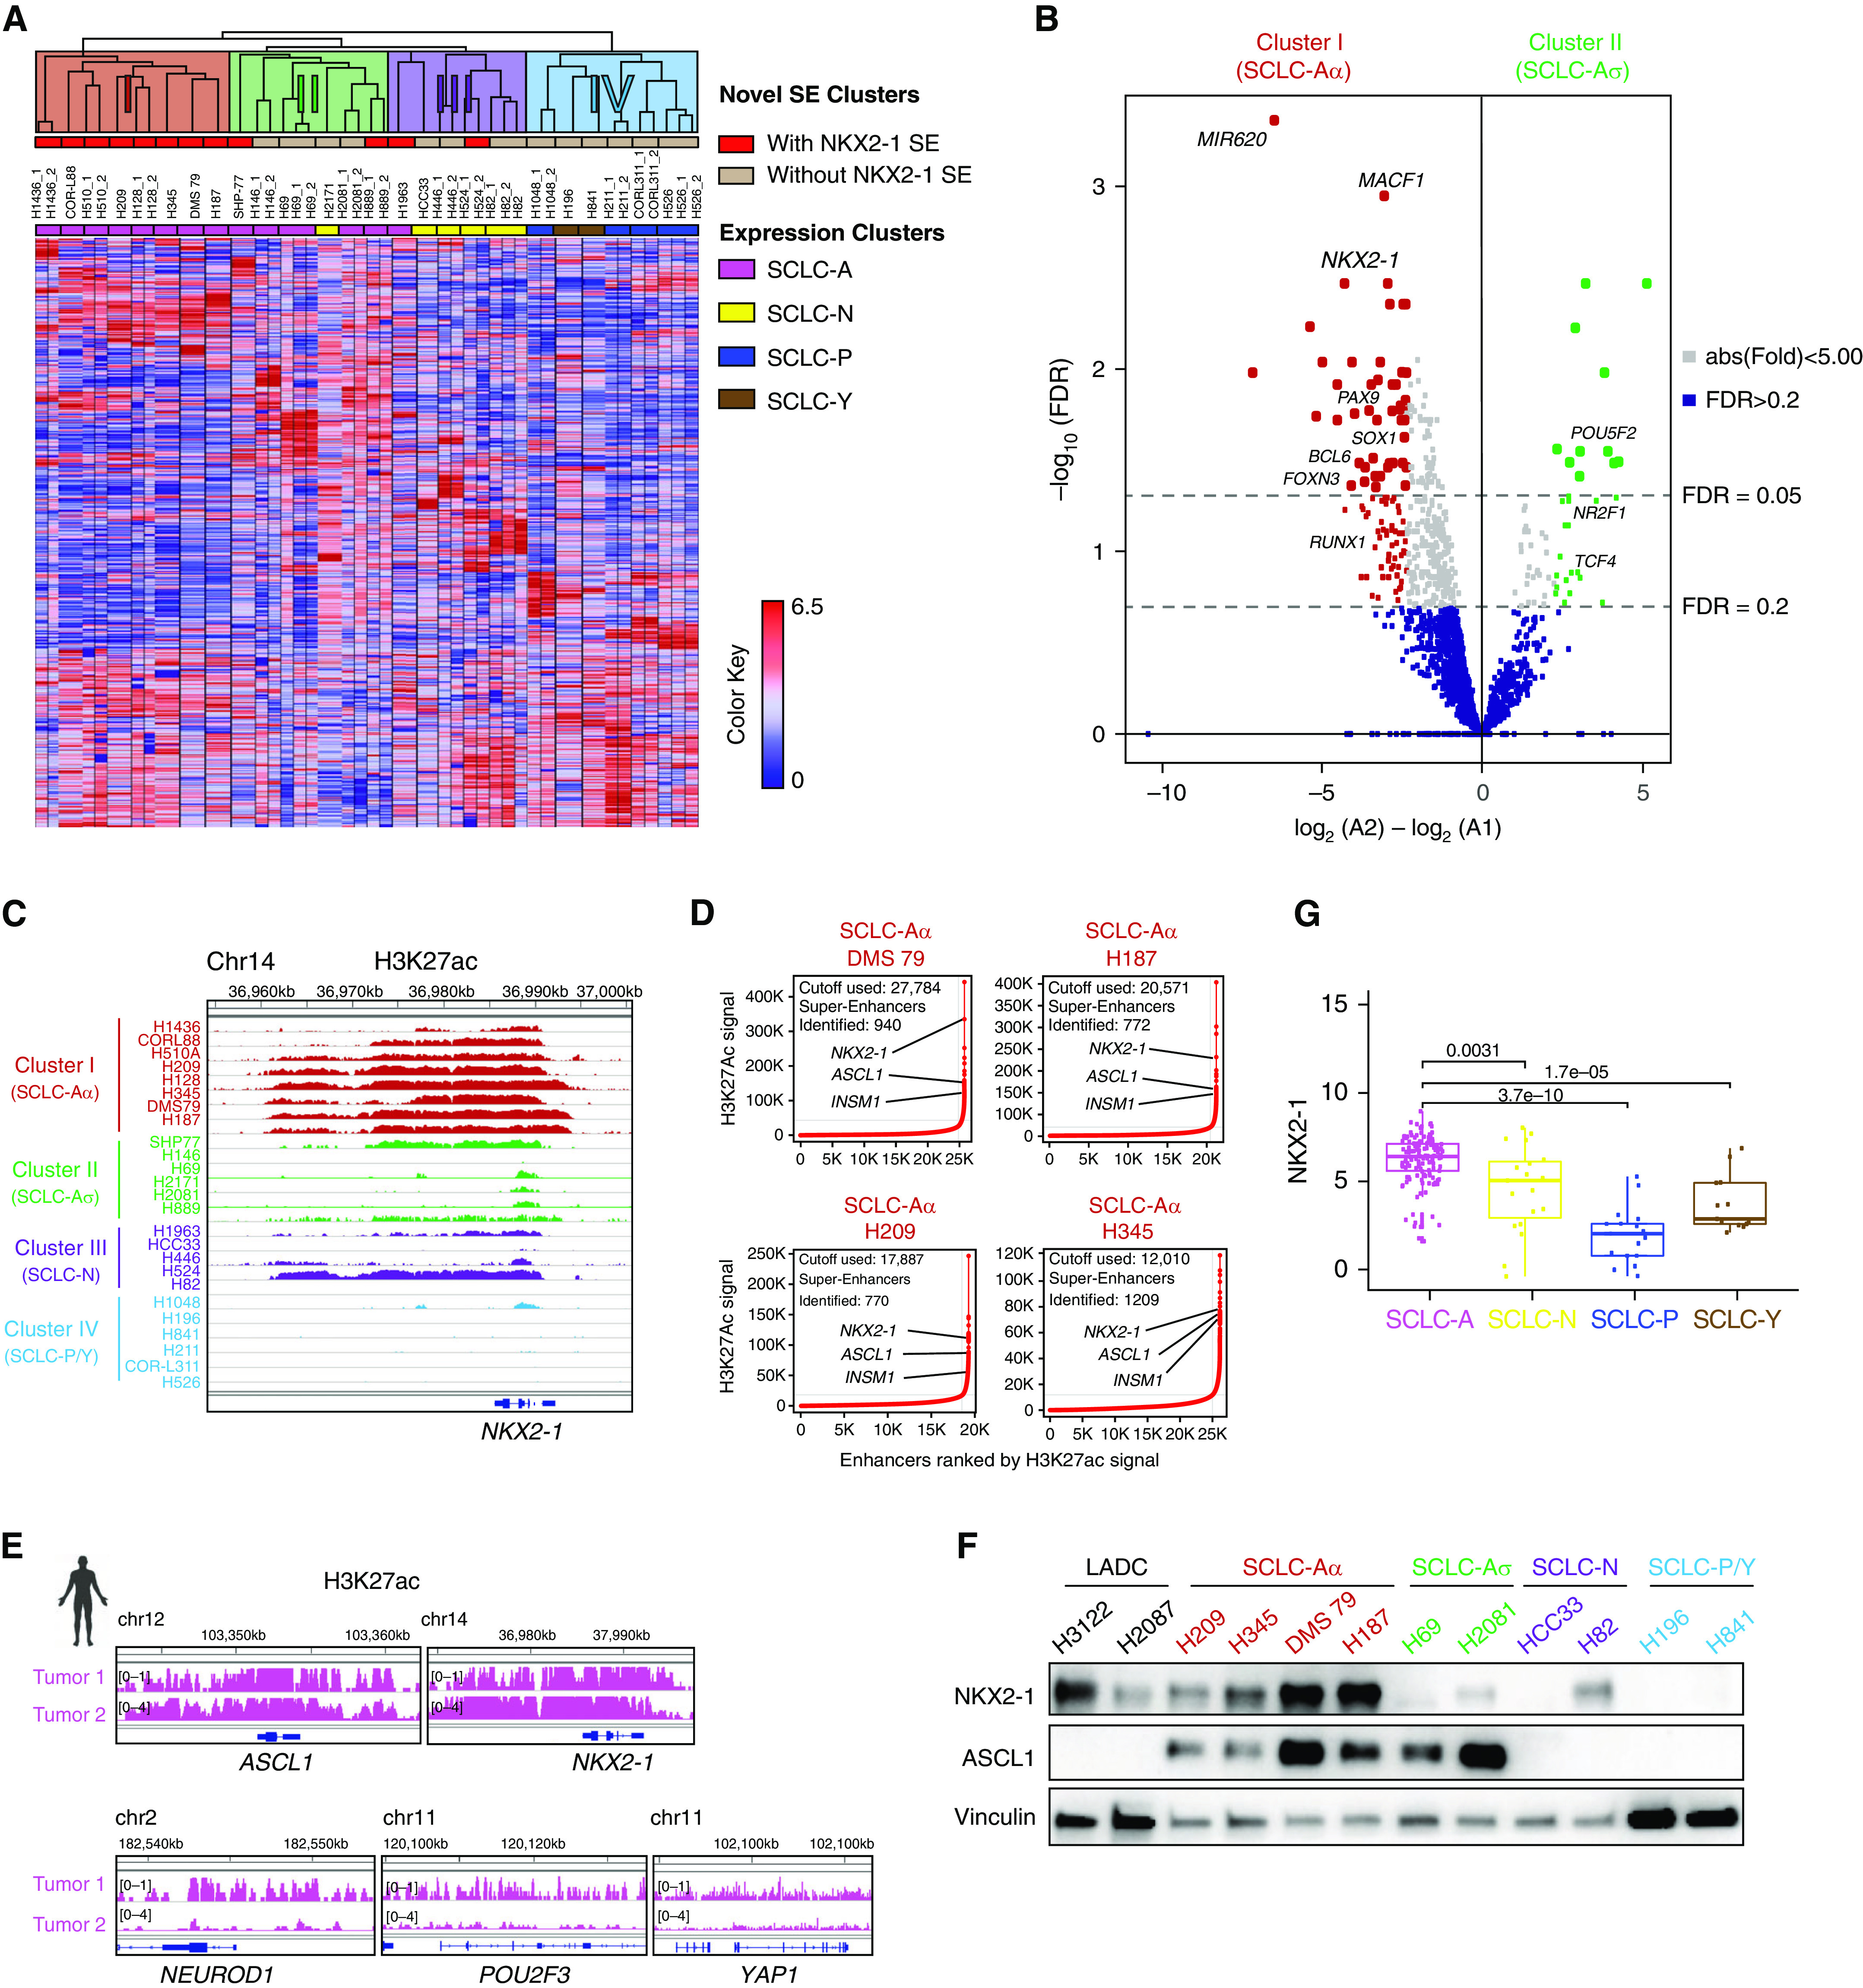
Figure 1.

Epigenomic profiling subdivided small-cell lung cancer (SCLC) subtype SCLC-A by differential super-enhancers (SEs). (A) Unsupervised hierarchical clustering using pairwise average linkage with Pearson correlation for column and row distance measures of 25 SCLC cell lines using SE signals near transcriptional regulator genes. The color scale indicates the intensity of SE signals normalized to linear scores using the sum of squares of the values. Each row represents an SE locus (747 loci). The color shades on the dendrogram indicate four novel SE clusters, the top red columns display the presence of SE near the NKX2-1 (NK2 homeobox 1) locus, and the bottom column colors denote the consensus expression clusters. (B) Volcano plot showing 133 differentially enriched SEs (104 enriched in SCLC-Aα and 29 enriched in SCLC-Aσ) at thresholds of absolute fold change > 5 and FDR < 0.2, depicted as dotted lines. (C) Genome view tracks of H3K27ac signal at the NKX2-1 locus in four clusters of SCLC cell lines. Normalized scales are shown in Figure E1B. (D) SE plots with all enhancers rank ordered by H3K27ac signals in cell lines DMS 79, NCI-H187, NCI-H209, and NCI-H345. Dotted lines depict tangential cutoffs to define SEs. (E) Genome view tracks of H3K27ac signals at the ASCL1, NEUROD1, POU2F3, YAP1, and NKX2-1 loci in two human SCLC specimens of SCLC-A subtype. (F) Protein expression of NKX2-1, ASCL1, and vinculin as a loading control in SCLC cell lines from different clusters. NKX2-1–amplified adenocarcinoma cell lines NCI-H3122 and NCI-H2087 are shown as reference. (G) Box and jitter plots showing the distribution of NKX2-1 mRNA expression in SCLC-A, SCLC-N, SCLC-P, and SCLC-Y subtypes of 135 primary SCLC tumors (5, 29). ASCL1 = achaete-scute homolog 1; chr = chromosome; FDR = false discovery rate; INSM1 = INSM transcriptional repressor 1; LADC = lung adenocarcinoma; NEUROD1 = neurogenic differentiation 1; POU2F3 = Pou domain, class 2, transcription factor 3; YAP1 = Yes-associated protein 1.
