
Figure 6.
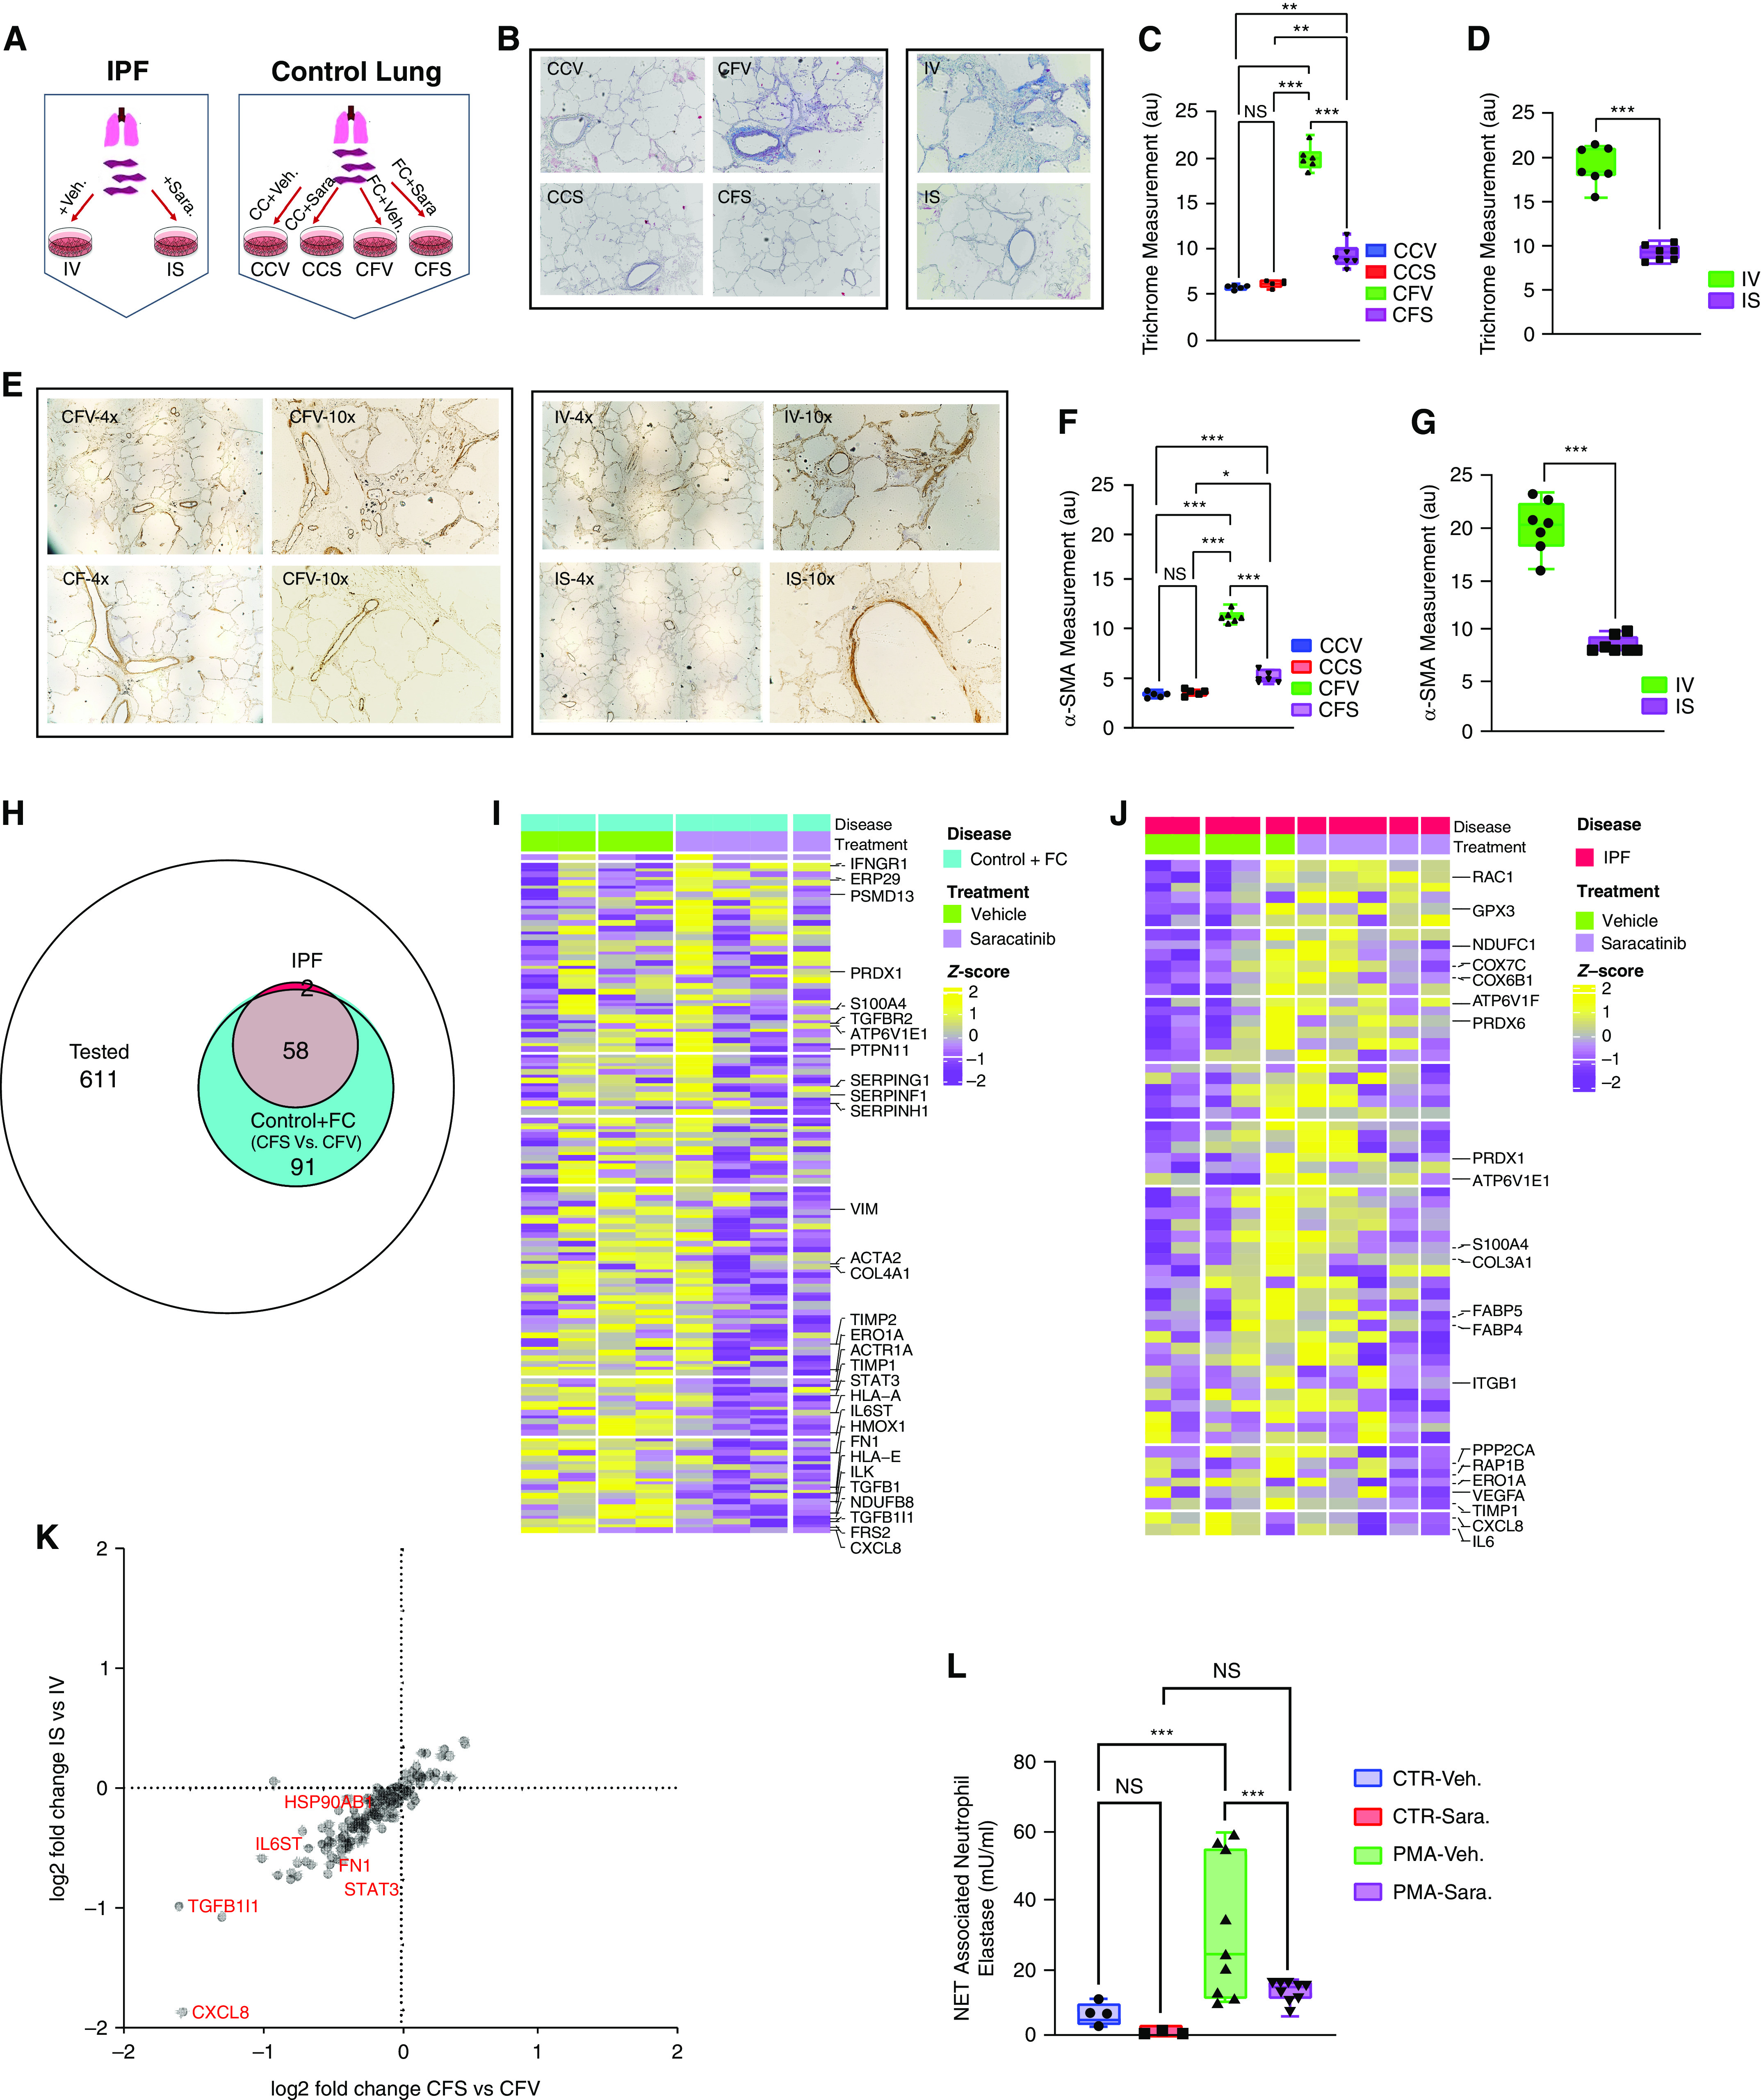
Saracatinib attenuates pulmonary fibrosis at the level of gene expression and collagen protein accumulation in ex vivo human precision-cut lung slice (hPCLS) models. (A) Schematic view of the experimental design. hPCLSs isolated from patients with idiopathic pulmonary fibrosis (IPF) were cultured and treated with saracatinib (0.6 μM) or vehicle for 5 days; IS (IPF + saracatinib) and IV (IPF + vehicle). In an independent experiment, the hPCLSs harvested from healthy donors were also cultured and treated with fibrotic cocktail (FC), (containing 5 μg TGF-β [transforming growth factor-β], 50 μg PDGF-AB [platelet-derived growth factor-AB], 10 ng TNF-α [tumor necrosis factor-α], and 10 mg lysophosphatidic acid), or control cocktail (CC), with saracatinib or vehicle for 5 days; CCV (control lung + CC + vehicle), CCS (control lung + CC + saracatinib), CFV (control lung + FC + vehicle), and CFS (control lung + FC + saracatinib). (B–D) Representative images and quantitation measurements of Masson’s Trichrome staining on the harvested slides from all groups at the end of the time points. (E–G) Representative images and quantitation measurements of α-SMA (α-smooth muscle actin) staining on the harvested slides from all groups at the end of the time points. (H) Venn diagram of the number of genes differentially expressed after saracatinib treatment in PCLSs from control hPCLSs with FC (CFV vs. CFS) (number of genes = 149) or IPF (IV vs. IS) (number of genes = 60) among all measured genes (number of genes = 761). (I) Heatmap of 149 differentially expressed genes (DEGs) in control hPCLSs with FC (CFV vs. CFS). Genes are ordered from highest to lowest fold change; z-scores are calculated across samples. (J) Heatmap of 60 DEGs in IPF PCLSs (IV vs. IS). Genes are ordered from highest to lowest fold change; z-scores are calculated across samples. (K) Volcano plot of the combined DEG results of both data sets; x-axis = log2 fold change of DEGs between CFS versus CFV; y-axis = log2 fold change of DEGs between IS versus IV. (L) Neutrophil extracellular trap (NET)-associated neutrophil elastase (mU/ml) measured from the phorbol myristate acetate (PMA)-induced neutrophil extracellular traps after 6 hours of incubation with saracatinib or vehicle. All data are presented as mean + SEM; *P < 0.05, **P < 0.01, and ***P < 0.001 (n ⩾ 6 in all groups). CTR = control; NS = nonsignificant.